WTI Oil - Slight Tuesday Rally: Stocks Still Oversold
Before we get into WTI Oil, let's review the stock market. S&P 500 was up one basis point on Tuesday which means it is still right at the low for the year.
Nasdaq increased 0.45% and the Russell 2000 fell 7 basis points. Because of the wild swings during the day, the VIX was up 4.32% to 25.58.
The increase in the VIX caused the CNN fear and greed index to fall from 10 to 8. This oversold reading combined with the fact that stocks usually rally on Fed decision days makes investors think stocks will rally sharply on Wednesday.
Some investors have said this is great for Powell because it will make whatever he does look like a good decision.
WTI Oil - A Few Specific Stock Market Signals
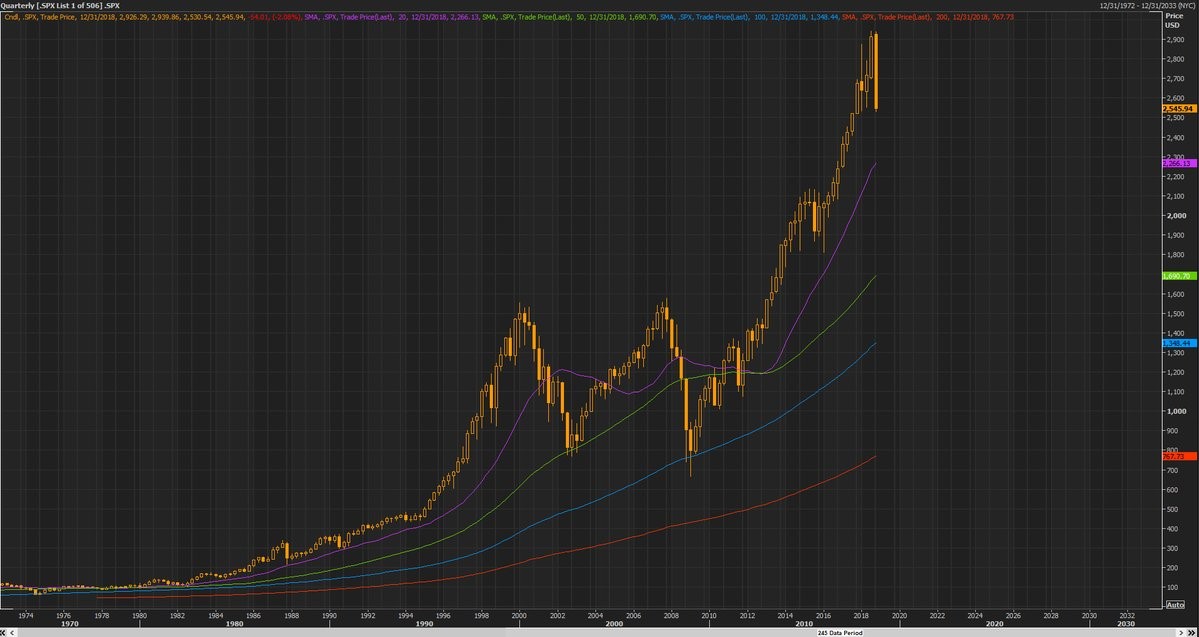
As you can see from the chart below, the current size of the S&P 500’s negative quarterly candle has occurred 5 times in the S&P 500’s history. The market has been up 4 out of those 5 times in the next quarter. Average return is 2.94%.
On the negative side, stocks have had an annualized price return of only 4.71% when the unemployment rate is under 4% since 1948.
When it is over 8%, stocks go up 22.17%. In the past 28 years, there have been 2 times when every S&P 500 energy sector stock has been below its 10, 50, and 200 day moving average, and more than half of energy stocks were trading at their 52 week lows.
The two times were the depths of the financial crisis and now.
WTI Oil Falls 40% From Its October Peak
Worst sectors were energy and consumer staples which fell 2.35% and 1.17%. The energy sector cratered on the decline in oil prices.
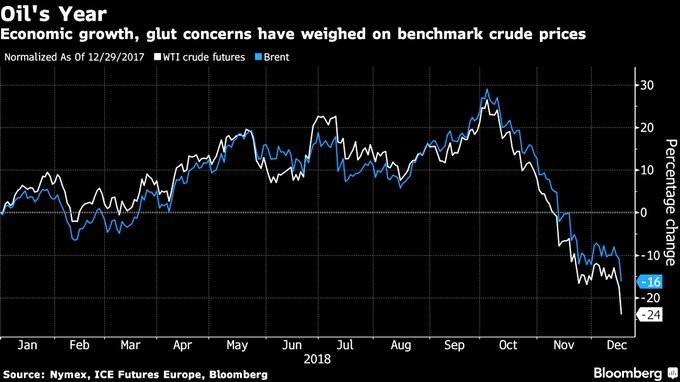
As you can see from the chart below, WTI is down 24% year to date and Brent is down 16%. Energy stocks did pretty great considering the 7.3% decline in WTI on Tuesday to $46.24. That's the lowest close since August 2017.
America and Russia are producing record levels of oil while the global economic growth is slowing.
From peak to trough, WTI is down 40% and Brent is down 23%. The peak was in early October, showing you how sharp this decline has been.
It’s the sharpest crash since the 2014 crash which predicted the economic slowdown from late-2015 to early-2016. This will further pressure headline inflation in December. It gives the Fed even more of a reason to be dovish at its December 19th meeting.
WTI Oil - Utilities Are Over-owned
Best sectors were consumer discretionary and real estate which increased 1.03% and 0.95%. The utility sector was down again. This time it fell 0.56%.
S&P 500 utilities ETF is still up 4.66% year to date, which signals it has a long way to fall. The S&P 500 is down 4.77% year today, which shows you how much utilities have outperformed.
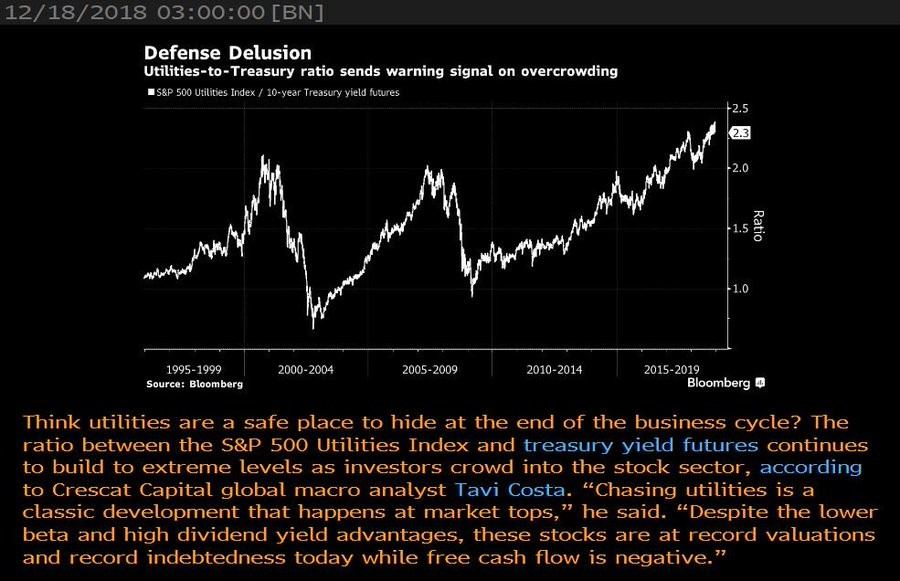
As you can see from the chart below, the ratio between the utilities sector and the 10 year treasury yield is at a record high which signals the sector is overcrowded.
Its gains this year aren’t supported by fantastic earnings growth. The sector’s free cash flow is negative and its indebtedness is at a record high. Utilities are an easy short.
WTI Oil - FedEx Craters On Weak Guidance
The biggest news after hours was FedEx’s earnings report. This company is a great bellwether for the health of the economy.
According to FedEx, global trade growth was 3.5% in Q3 which is much slower than the 5.3% growth in Q3 2017. The firm beat estimates on the top and bottom line. But reported weak guidance which sent the stocks crashing after hours.
The firm reported EPS of $4.03 which beat estimates for $3.94. It reported revenues of $17.8 billion which beat estimates for $17.75 billion. It lowered its full year guidance from $17.20 to $17.80 to $15.50 to $16.60.
That’s way below the consensus of $17.33. The stock fell 6.06% after hours. From September 17th to December 17th, the stock fell 28.76%. That shows the market expected this weakness.
WTI Oil - Treasury Yields Fall Further: Rate Hikes Done?
Yields fell sharply, and the curve steepened further as the expectations for rate hikes fell. The 10 year yield fell 4 basis points to 2.82%.
My prediction for the 10 year yield to fall below 3% has been stellar after being wrong initially. The yield has fallen from 3.26% earlier this fall. 2 year yield fell 5 basis points to 2.64% as rate hikes expectations fell. Good news is the difference between the 10 year yield and the 2 year yield has increased to 18 basis points.
It’s tough to say if a hike would invert the curve because it will probably be a dovish hike, and the curve it has steepened in the past few days.
A hike, with the CME Group FedWatch tool showing a 68.9% chance of one, would be unusual. More importantly, the futures market thinks the most probable scenario for the end of 2019 is rates between 2.25% and 2.5%, which is just 25 basis points higher than where they are on December 18th.
The most interesting pricing in the futures market is that there is a 2.8% chance of a rate cut by January 2020. If rates are hiked on Wednesday, these odds increase to 24%.
WTI Oil - Does The Equity Correction Signal A Recession?
The decline in stocks this fall doesn’t signal a recession is necessarily coming.
As you can see from the chart below, the rolling 10 year regression of real GDP growth has an R squared of 0.307 when compared to the year over year quarterly average of stock returns advanced one quarter.
Stocks and the economy rhyme, but this correction far from guarantees there will be a recession in 2019. All we know is trade growth is slowing because of cyclical weakness and the tariffs.
The U.S. economy is seeing manufacturing and services weakness, but Q4 GDP growth will likely be at least 2%. The Atlanta Fed GDP Nowcast now expects 2.9% instead of 3% growth.
That’s far from a recession which is 2 straight quarters of negative GDP growth.
