Amazing Q2
S&P 500 increased 19.94% in Q2 which was the best Q2 since 1938. The market was 6 basis points away from having the first down 20% quarter followed by an up 20% quarter since 1932. We are in rarified territory even though this mark was barely missed. This was the S&P 500’s biggest quarterly increase since Q4 1998.
Keep in mind, this performance is boosted by the timing of the bottom. Stocks bottomed just a few days before the end of the quarter. On the other hand, this was one of the strongest rallies ever, so let’s not take anything away from it.
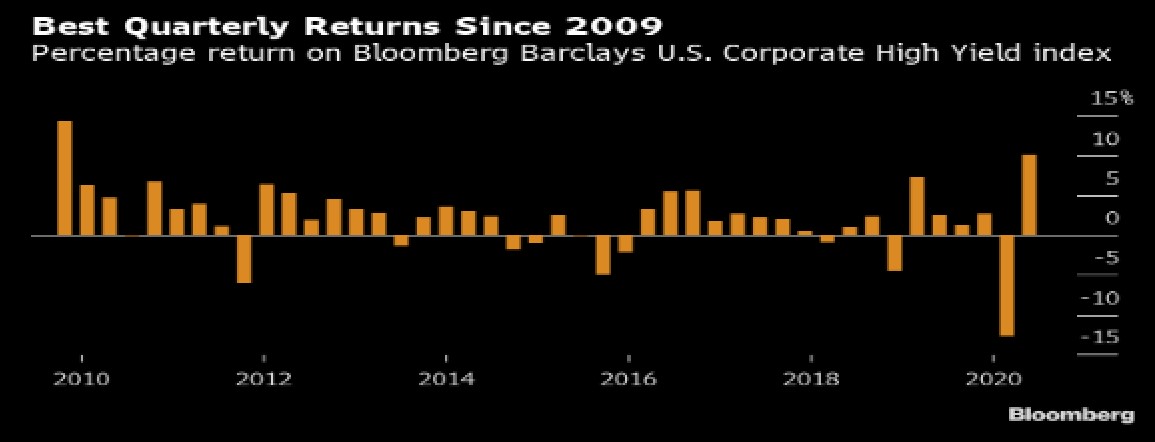
Dow was up 17.8% which was its biggest rally since Q1 1987. Obviously, we know what happened in October 1987. That's not to say it will happen again, but it’s notable. Nasdaq was up 30.6% which was the best quarter since 1999. That’s very scary because the tech bubble burst in Q1 2000. As you can see from the chart below, the corporate high yield index had its best quarter since 2009. This was a risk on quarter for markets.

Nasdaq Nears Another Record High
Remember when cloud stocks and the Nasdaq underperformed on Monday? That’s long gone. It was a blip on the radar. Nasdaq rose 1.87% and the CLOU cloud index rose 1.71% on Tuesday. S&P 500 was up 1.54% and the Russell 2000 was up 1.42%. Since it was the end of the quarter, there was window dressing.
This tactic, which aims to make portfolios look like they held the winners, was stronger than usual because of how intense the rally was. We have seen performance chasing since May. This was a quick spike in the best names just to show ownership at the end of the quarter.
Specifically, Tesla was up 6.98% to a new record high. It has a $200 billion market cap. If it shows a profit, it will be entered into the S&P 500. This could be one of the biggest entrants into the index ever. There will be an intense amount of forced buying as the indexes add this stock.
Crazy thing is the bigger it gets, the more index buyers will need to acquire. It’s scary to imagine that a company that’s only profitable because of carbon tax credit sales is about to have a significant impact on the overall stock market. The stock is up 151% year to date as many wonder how long this can go on. The company would have a $500 billion market cap if it rose this much in the 2nd half.
Shopify stock was up 2.9% on Friday as it is up 131% year to date. Finally, Livongo stock was up 5.07% on Tuesday. It’s up 198% year to date. These stocks are all big bubbles. People only buy them because of their recent performance. They don’t look at valuations.
Sector Performance
Ever sector was positive on Tuesday. Energy was the biggest winner as it was up 2.2% because crude inventories fell 8.2 million barrels to 537 million. That was way different from the expected draw of just 710,000. Crude oil is at $39.69 which is a vast difference from the negative reading it had in April. It was a blip which will likely never happen again. Healthcare and tech were up 1.81% and 1.92% which makes sense because they have been the biggest winners this year. Utilities were up 0.41%.
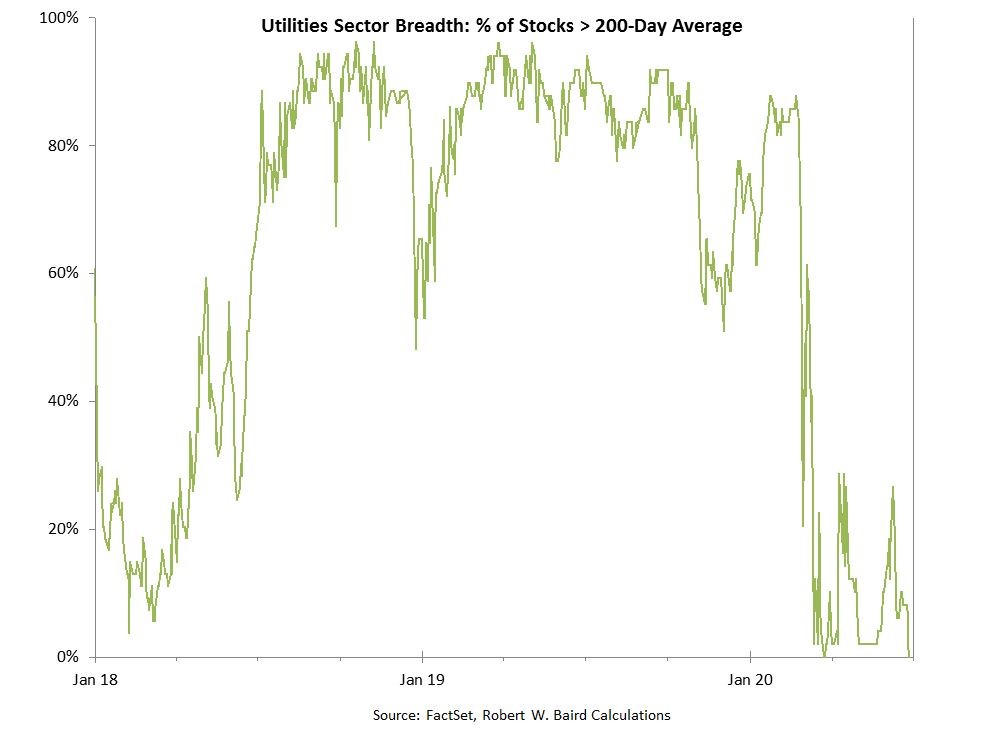
As you can see from the chart below, almost none of the utility stocks are above their 200 day moving average. This looks a lot like January 2018 which is a bad sign for the stock market because the short VIX trade exploded soon afterward. This time, the cloud trade is about to blow up. This is a much bigger deal than the VIX trade because it involves the biggest companies in the index.
Growth and momentum have done so well recently, they dominate the index. Tech sector is 27% of the S&P 500 and not all the FAAMNG stocks are even in that sector. When you add in biotech and other hot growth stocks like Tesla and Beyond Meat, almost 40% of the index could be exposed to a large drawdown.
A big 15% decline in the Nasdaq that some have been predicting for a few weeks hasn’t materialized. Some are bullish on the part of the market not exposed to this bubble. That means we like the industrials, materials, consumer staples, real estate, financials, the utilities, and energy. That sounds like a lot of sectors, but they don’t add up to much because of how poorly value has done compared to growth.
Yield Curve Inversion
The stock market has mostly ignored the spike in COVID-19 cases which has caused the recovery to stall. And the treasury market hasn’t ignored it. 10 year yield is still very low as it’s at 68 basis points. As you can see from the chart below, yield curves are starting to invert as the 1 month US OIS 2 year minus 1 year spread has inverted again.
Investors remember when obscure curves started to invert in 2018 and then almost the entire curve inverted in 2019. The yield curve predicted this recession. But that was out of luck because COVID-19 was unpredictable. Without it, there wouldn’t have been a recession. Either way, it's good to still follow the yield curve, just don’t worship it.

Conclusion
The stock market ended its amazing Q2 on a high note. Not to ruin the party, but I the cloud stocks are probably in a bubble. They have gotten so large, they can take down the entire index if the growth stocks also fall.
It's unlikely that Amazon and Microsoft are bubble stocks themselves. But they will likely fall at least 10% in sympathy with this bubble crash. We can see stocks like Livongo, Tesla, and Shopify falling over 30%. Utilities will turn around after months of poor performance.
1 Comment
Collins
July 1, 2020CLOU ETF Top Holdings - TWLO, ZM, ZS, COUP, SHOP, PAYC, EVBG, WDAY, PAYC. Any others you see bubbling over?