Weak Housing Market - MBA Mortgage Index Increases Week Over Week
Home builder stocks suddenly are cratering. Also, banks are falling on worries that high mortgage rates will stifle demand for loans. Housing reports are the most important economic reports to review.
There were three reports on Wednesday. First, we have the MBA mortgage applications index from the week of October 19th. This is a weekly report which means it is volatile.
The composite index was up 4.9% from last week. The purchase index was up 2% and the refinance index was up 10%. It’s important to contextualize the data.
They were up on weak comparisons as the previous week had a sharp decline. This report doesn’t mean the housing market is recovering.
Year over year increase in purchase applications fell from 1.8% to 0.2%. The comparisons altered those results. Refinancing is 39.8% of mortgage activity.
The average 30 year fixed rate mortgage was up 1 basis point to 5.11%. This is the highest level since February 2011. Mortgage rates are up 93 basis points year over year.
Purchase applications are about to go negative on a year over year basis, just as August. It shows us that this was far from a spectacular report.
Weak Housing Market - FHFA Housing Price Index
The FHFA housing price index is from August. Meaning, it clarifies why investors in home builder stocks are panicking. The index was up 0.3% month over month. That fell from last month’s 0.4% increase and met expectations.
It was up 6.1% year over year which is down from the 6.6% increase in July. This reading is the worst growth rate since January 2017.
Best region was the Pacific which was up 0.8% month over month and 7.3% year over year. Mountain region was up 8.4% year over year and unchanged month over month.
Denver and Seattle have been some of the hottest housing markets as speculation and job creation have pushed up prices.
There is a general trend of people moving west. Amazon’s job creation is great for Seattle. There are also restrictions on multi family home building in cities like Seattle. This prevents supply from meeting demand.
The weakest reading was the middle Atlantic. It fell 0.7% month over month and was up 4% year over year.
Weak Housing Market - Weak New Home Sales
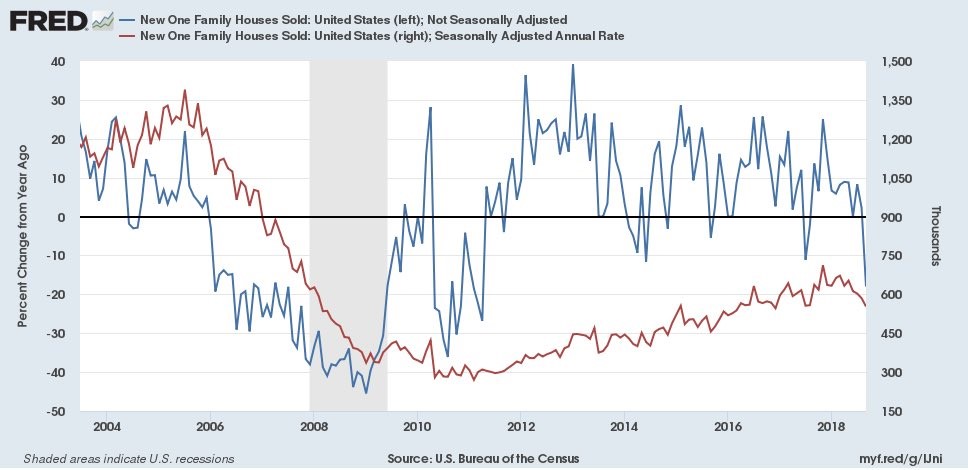
Seasonally adjusted annual rate of new home sales fell from 585,000 to 553,000 in September. Revised August sales fell to 585,000 from 629,000.
September's report missed estimates and missed the lowest estimate which was 610,000.
As you can see from the chart below, the non-seasonally adjusted data shows sales fell almost 20% year over year. Seasonally adjusted single family home sales are up 3.4% year to date versus 2017.
It looks like the cycle high was made in November 2017 which was 10 months ago.
In the last 50 years, it has taken at least 11 months for new home sales to peak before a recession hits. On average, they peak 28 months before recessions which implies the next recession will occur in 18 months which is in early 2020.
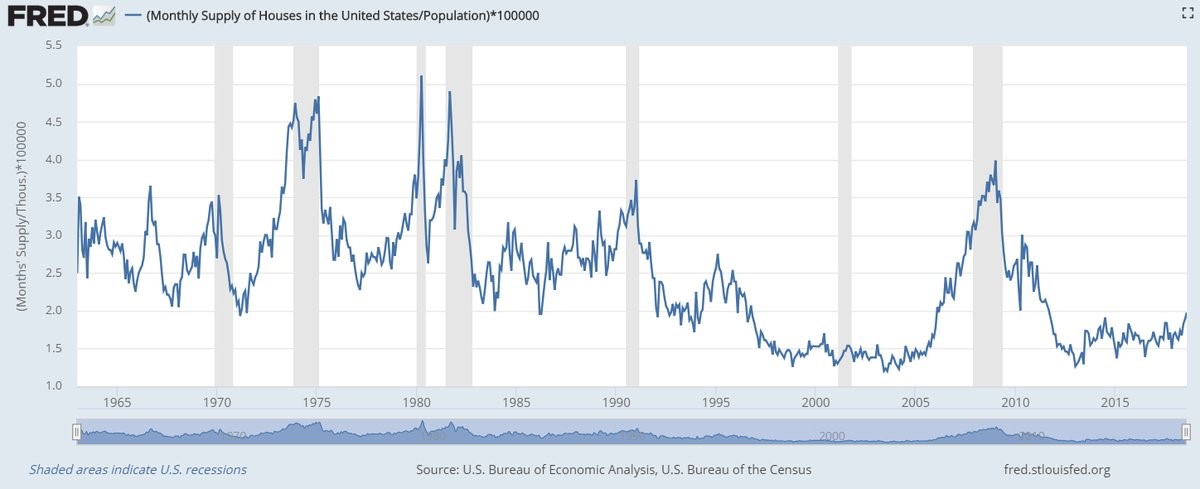
Supply was up 2.8% month over month and 16.8% year over year for a strong reading of 327,000. Relative to sales, supply is strong as supply is at 7.1 months which is up from 6.5 months in August.
Even when you adjust for population, supply is up as you can see from the chart below. This will pressure prices. Prices were up 0.3% month over month to $320,000.
Median prices were down 3.5% year over year. The worst sales region was the west which fell 12% month over month and 15.8% year over year. The Midwest was the best as sales were up 6.9% month over month and 4.1% year over year.
Weak Housing Market - Strong PMI Composite Flash
In the midst of the stock market volatility and somewhat wild calls for a recession, the Markit flash PMI for October beat estimates. Thus signaling the economy is still growing.
Composite index beat estimates for 54.1. It came in at 54.8, much higher than September’s reading of 53.4. Manufacturing index was 55.9, beating estimates for 55.5 and the prior reading of 55.6.
Discounts the weak Richmond Fed index which has a very small sample size. This Markit report had the strongest manufacturing PMI in 5 months.
New orders were strong, but export sales were weak. There were capacity constraints unlike some of the regional Fed surveys as delivery times increased. Delivery times reading was the most severe in this expansion.
Oil and metals costs (tariffs) were up. Thus causing the pass through reading to be one of the highest in the past 7 years.
The services PMI was 54.7 which beat estimates for 54 and was much higher than September’s reading of 52.9.
New orders were called “robust.” This report hurts the bearish narrative on the economy, but didn’t cause stocks to rally Wednesday. The one negative part of this report was the hiring rate was the slowest since June 2017.
Input costs were at a 5 year high. Headline PMI is consistent with GDP growth of 2.5%. Q3 GDP growth is expected to be 3.3%. That means this report implies Q4 growth will slow slightly.
It’s interesting to see that stocks have declined in October partially because of tariff worries. But this report says the domestic economy was resilient in the face of trade worries. This reading can change after the revisions come out in a couple weeks, but for now it looks good.
Weak Housing Market - Conclusion
There might not be a recession in the next year. The Markit PMI was strong. And the housing market is usually a leading indicator which is way ahead of the overall economy.
That makes it difficult to tell where stocks are headed. GDP growth might be above 3% in Q3, but economic growth is slowing. I think that makes corrections more prevalent. However, it means this bull market should continue for at least the rest of the year.