Strong Kansas City Fed Report
The Kansas City Manufacturing report saw none of the weakness shown in the Richmond Fed report. The manufacturing trends in each regional survey aren’t always correlated. The headline number was 26 which was better than last month’s 17. This was the best report in at least a year. The volume of new orders index increased to 37 from -1. That’s an increase unlike what was seen in the other reports. The main increase in new orders was from domestic customers as the international export orders index was only +1. 58% saw an increase in raw materials prices paid from last month, 38% saw no change, and 5% said prices fell. This is much like the other surveys. There’s no category which asks about wages. The expectations indexes were similarly positive as 55% expect an increase in production, 36% said no change, and 9% expect a decrease. The expectations composite index was 31 which is down 7 points from 2 months ago, but still shows high optimism.
Weak Core Durable Goods Orders
The headline durable goods report was strong, but the core number was weak. New orders were up 2.6% month over month which was better than the 1.7% consensus. The prior report was revised higher by 4 tenths to 3.5%. The civilian aircraft demand drove this increase as there was a 44.5% monthly gain. This segment was also the reason growth was strong in February as orders were up 39.1%. Excluding transportation, new orders were flat which was 5 tenths below the consensus and 9 tenths below last month. Core capital goods fell one tenth month over month which was 7 tenths below the consensus and 1% below last month. There was strong demand for metals which saw a 1.3% increase in ordered, while machinery saw weakness as demand fell 1.7%.
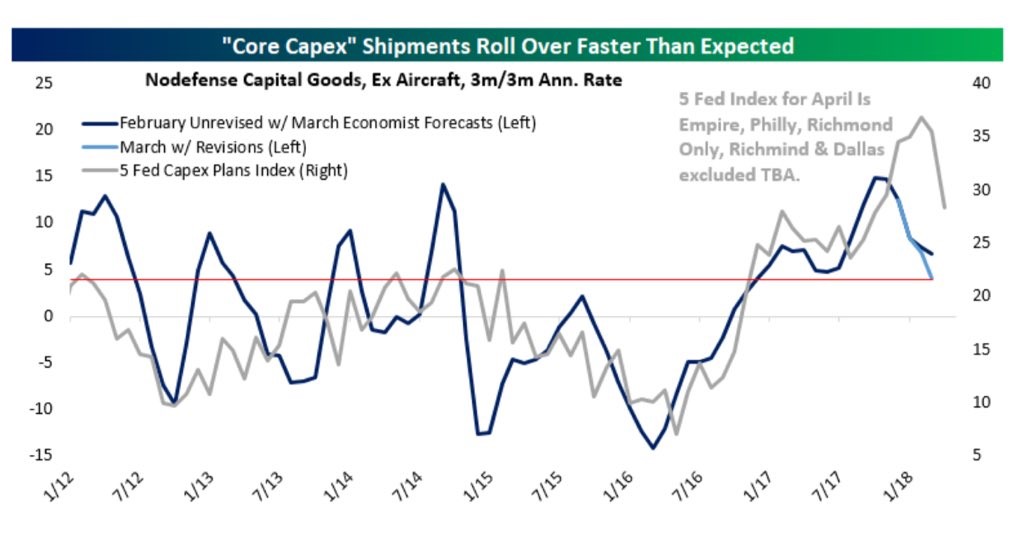
The chart below shows the core capex shipments on a quarter over quarter basis. They signal the economy is going from great to good quickly. If the grey line included the Richmond Fed survey, it would be more optimistic, but the government numbers are what matters and they are weak. The core capital spending in March is no different from October despite the passage of tax reform which was supposed to incentivize capex.
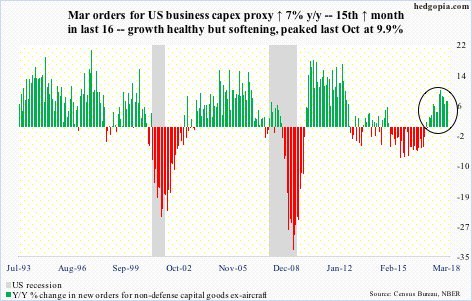
The chart below shows the data on a year over year basis. The ‘great to good’ narrative is shown as the year over growth was 7%. This was the 15th month of growth in the prior 16 months. Year over year growth peaked in October at 9.9% as March orders were up 7.7%.
Final Estimate For GDP
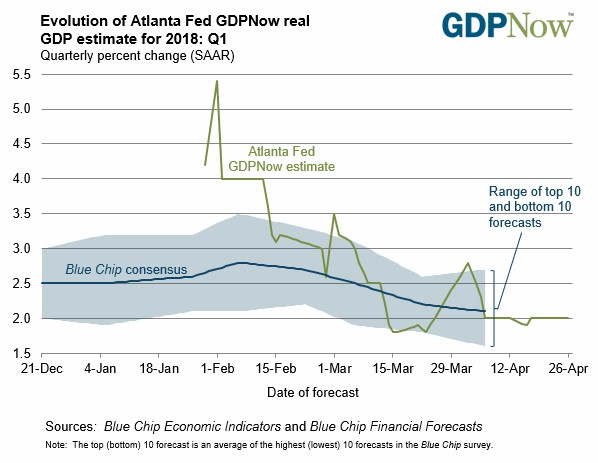
The advanced GDP estimate will be released on Friday morning. The chart below shows the GDP Now’s final estimate is for 2% growth. That’s exactly what the census expects. The durable goods report caused the estimate for real nonresidential equipment growth to fall from 7% to 4.2%. The international trade report caused the estimate for net exports’ contribution to GDP to increase from -0.68% to -0.3%. The trade deficit was $68 billion which beat estimates for a $74.5 billion deficit. Exports were up 2.5% and imports were down 2.1%. This could be the early effects of the tariffs working since imports of industrial supplies fell 1.9%, but it’s too early to tell. The hope is import weakness doesn’t continue to correlate with a weaker economy even though technically it helps GDP growth.
Amazing Jobless Claims
I was wrong about the jobless claims being near the bottom as they fell 24,000 to 209,000. This was below the consensus estimate of 230,000 and below the lowest estimate in the range which was 225,000. The prior report was revised up 1,000 to 232,000. It will be interesting to see if this report will be revised because it’s so low. There were no special factors affecting this report, but 15,000 NY educational workers didn’t file during spring break, pushing down the number.
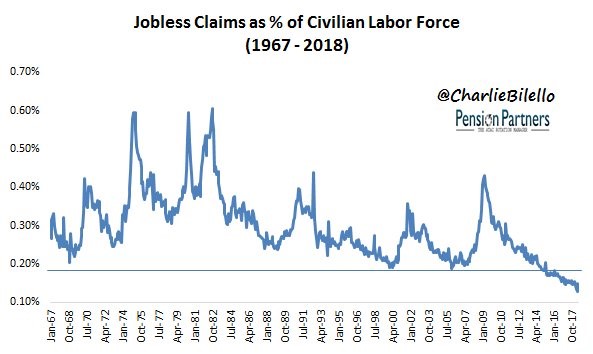
It was the lowest report since 1969. The report on a population adjusted basis is seen in the chart below. It has been below the previous cycle low for a few years. Usually, a low jobless claims report is a bad sign for stocks because it signals the cycle is over. However, this has been a false flag for a few years because of the increase in the participation rate. There are also more independent workers who may not qualify for unemployment insurance.
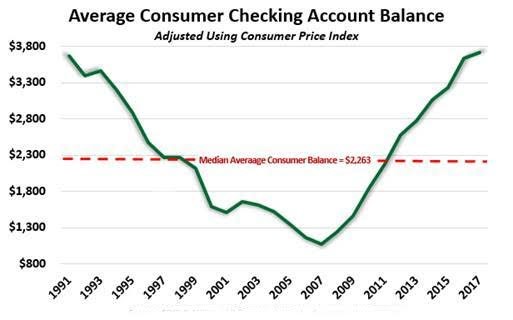
Increasing Consumer Checking Account Balances
The chart below shows the money the average consumer has in its checking account is the highest in at least 27 years. The theory is more cash in these accounts means consumers are searching for safety. This is interesting because the cash as a percentage of investments is extremely low. Initially, those two stats seem counterintuitive, but I think they are reasonable. With such low interest rates, it has made little sense to have money in a savings account instead of a checking account. Checking accounts allow you to pay bills, but offer lower interest rates. A savings account with a near zero percent interest rate doesn’t offer an advantage.
On the other hand, low interest rates encourage investing in risk assets instead of keeping the money in cash. That explains the historically low cash to investments ratio. The other aspect of this chart is checking account balances were suppressed when people were buying houses they couldn’t afford in the early 2000s. I don’t think this chart should cause you to be negative on the economy since consumer spending has increased along with checking account balances in this expansion. I think it’s good news there’s money in their checking accounts considering the record credit card and auto debt.
Conclusion
The weak durable goods orders suppressed GDP growth, but the lower than expected trade deficit caused estimates to increase. The current estimate is for 2% GDP growth. The St. Louis Fed and NY Fed’s Nowcasts haven’t been updated since last Friday, but it’s worth mentioning they are at 3.5% and 2.91% respectively. The market probably won’t have a strong response to the report if it’s plus or minus 0.3% from the consensus. The Amazon and Microsoft earnings reports might affect the S&P 500 more than the GDP report on Friday.