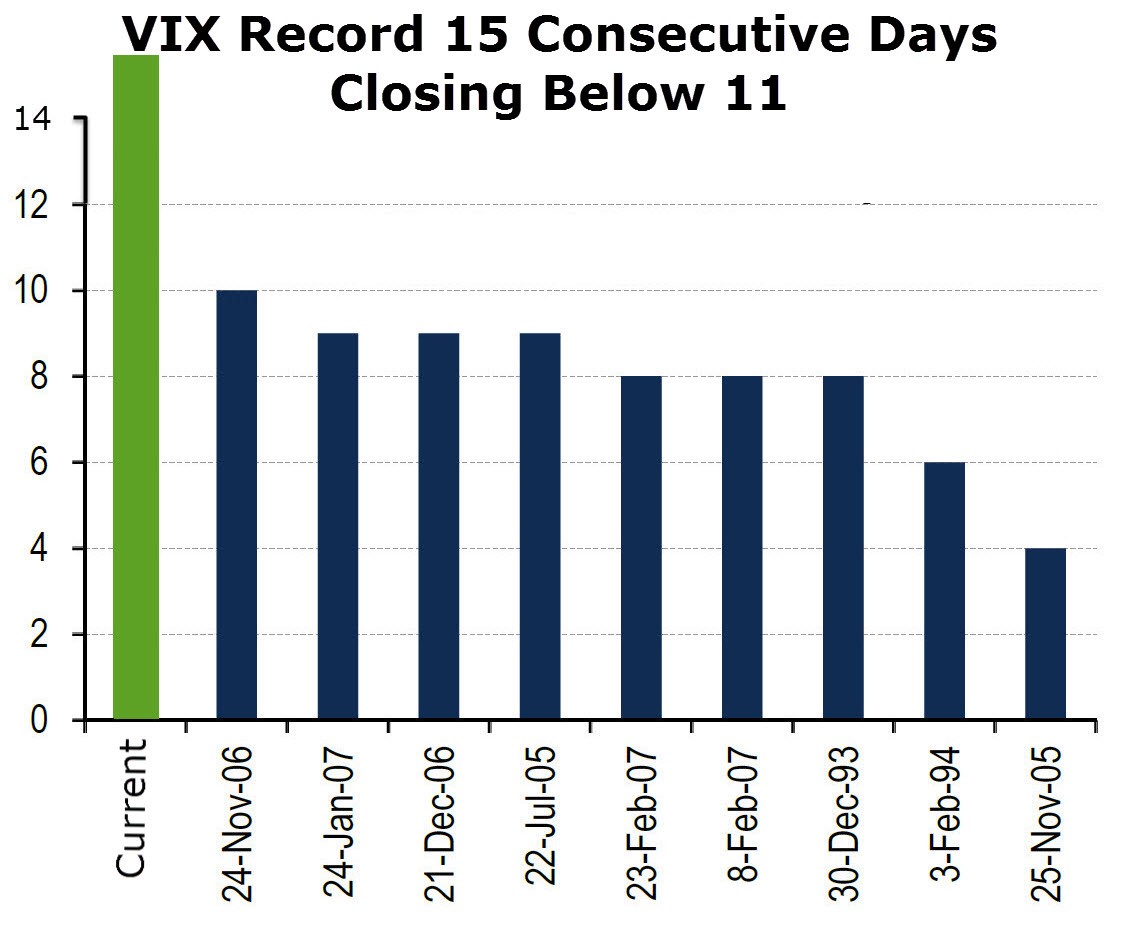
The stock market’s movement on Friday was almost identical to Thursday. The market fell slightly because of the weakness in retail; the VIX stayed below 11 for the 15th consecutive day. As you can see in the chart below, the streak of the VIX being below 11 made another new record, destroying the previous one. JC Penny led retail lower on Friday as the stock fell 14%. JC Penny’s stock has fallen to the lowest level since 1972. Revenues for Q1 were $2.71 billion which was below estimates for $2.77 billion. Same store sales fell 3.5% which was much worse than the expectation for a 0.6% drop. As I mentioned when discussing Macy’s, the fact that JC Penny was able to miss low estimates by a wide margin shows that the declines are out of control. The economy is interconnected, so weakness in retail can spread to other parts of it. The weakness Capital One is seeing is in tune with what JC Penny reported, so this weakness isn’t only about the shift to spending online. It’s weakness across the board.
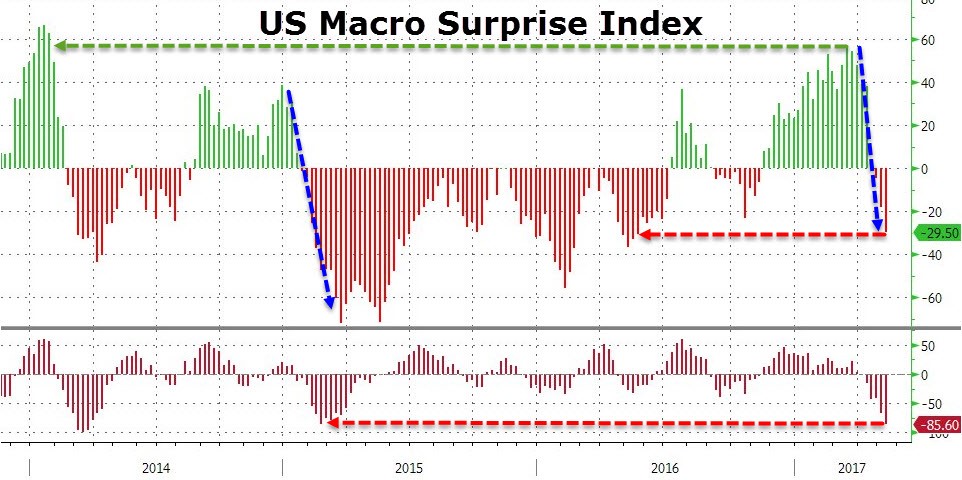
The other major movement in the market was the sharp rally in the 10-year bond. The yield fell 9 basis points in the past two days reaching 2.3257%. The 10 year reflects the macroeconomic environment which the stock market has been ignoring. Usually I don’t agree with stocks ignoring weak economic fundamentals, but the great earnings reports (excluding retail) make this divergence logical. The chart below shows the economic weakness.
As you can see, the Citi Economic Surprise Index has been cratering in the past few weeks. All the optimism from Trump’s election has been reversed as the index went from near 60 down to -29.50. This is the worst reading since mid-2016. The economic weakness in 2015 was associated with the crash in oil prices. The early 2016 recession scare occurred after the Fed raised rates; investors saw the rising default rates as a sign of a new recession. The latest economic weakness is coming from the lack of fiscal policy stimulus which fueled the initial optimism. Nothing has gotten done yet and the hard economic data has weakened.
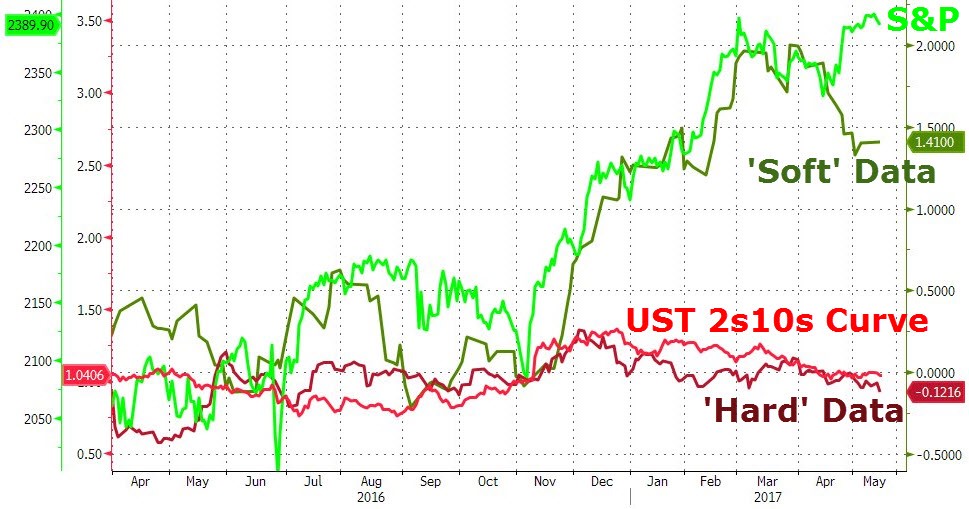
The chart below shows the latest movements in the yield curve, the soft data, the hard data, and the S&P 500. As I have been predicting, the soft data has weakened because the political controversies are lowering the hope that tax cuts will be passed. It’s human nature to become disappointed when you expect great things and nothing happens. Even if President Trump’s term had been going smoothly, passing tax cuts by now would be tough given the disjointed nature of Congress and high budget deficits. The belief that President Trump was going to get legislation passed easily was irrational because he doesn’t control that process. Given the weak hard data, it was only a matter of time for the soft data to converge with it.
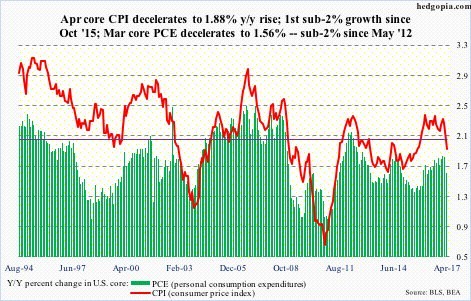
Besides the weak survey data, the 10-year bond yield also fell because of the weak inflation reports. As you can see from the chart, the April core CPI decelerated to 1.88% growth year over year. This is the first sub-2% growth rate since October 2015. The 2% rate is important because it’s what the Fed targets. Even though the core CPI doesn’t include the volatile food and energy inflation, the rate still hasn’t stayed near the 2% target for long. The personal consumption expenditure index was also weak as it decelerated to 1.56% growth. It has been below 2% since May 2012. With both indicators showing deceleration, the Fed policy of raising rates 3 times this year needs to be questioned.
It’s tough for me to handicap the Fed’s decision making process because I had forecasted zero rate hikes this year. The GDP growth of 0.7% normally would give the Fed pause, but this time it decided to ignore the economy and raise rates in March. That was the weakest GDP growth with a rate hike since 1980. With this in mind, it looks like the Fed will go along with a rate hike in June and ignore the inflation declines. It brushed off the weak March labor report calling it transitory. It can easily say the inflation deceleration is also transitory.
The latest NY Fed forecast sees Q2 GDP growth coming in at 1.9%. It was raised by one tenth because of retail sales and price indexes. This is preposterous given the terrible reports from Macy’s, JC Penny, and many other retailers this week. Not to be out done, the Atlanta Fed’s GDP Now forecast remains at 3.6%. The Q2 GDP report won’t be out by the next Fed meeting in June. The Fed will have the revised Q1 report at its hands. If the GDP growth rate isn’t revised much higher, then the Fed will have to answer questions about the weak economy after it raises rates.
The odds of a Fed rate hike in June are still 78.5%. I think the June labor report will be the only thing which can move the odds lower. It would have to be a very bad report to stop the Fed from hiking rates. The argument for hiking rates is that the tight labor market will cause wage inflation. It hasn’t happened yet, but the jobless claims, BLS payrolls, ADP, and NFIB survey signal it might. The four-week moving average of continuous jobless claims fell to 1.97 million which is the lowest level since 1974
Conclusion
The lack of volatility is unprecedented. The latest weakness in soft data has done nothing to push equities lower. The 10-year bond has rallied on the back of the weakness along with the weak inflation reports. The Fed is set on hiking rates in June because of tightness in the labor market. Hiking rates with an economy barely growing is a recipe for a recession. Trump’s fiscal stimulus will be needed to prevent this so the economy can have one last temporary boost before the next recession. While I think the expectation for 3.6% GDP growth in Q2 is ridiculous it’s too early to be sure of the rate the economy is expanding at.