Impact Of Lower Benefits
Two aspects of consumer spending are worth following. Firstly, we can look at the impact of the elimination of the $600 in weekly unemployment benefits and then the $300-$400 in weekly benefits that are gradually being brought back state by state. There wasn’t a massive decline in spending in the beginning of August after the benefits went away because people who are working made up for those who lost benefits (some saved in advance of losing the benefits).
Unfortunately, it will take months just to get continued claims below the peak of the last recession. Therefore, the extra $300 to $400 is necessary even though spending didn’t crash in the first half of August.
As of last Thursday, 40 states were approved to give out benefits. So far, 6 states are paying the money out. Texas is one of them which is important because it’s large. Louisiana is another which is important because it was hurt by hurricane Laura. Arizona planned to finish the retroactive payments 2 weeks ago. Those getting $300 weekly will be getting $1,200 in retroactive payments (4 weeks). That could cause a nice boost to spending. It’s like a mini stimulus.
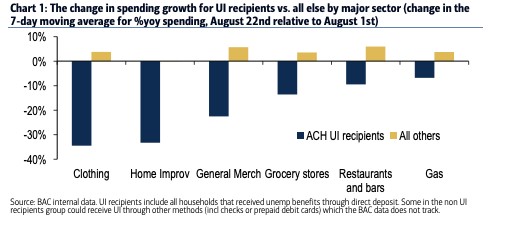
The chart above shows the changes in spending in a few categories from August 1st to August 22nd based on whether people received unemployment insurance. As you can see, the benefit recipients spent much less on clothing, home improvement, and general merchandise. Clothing is now no longer a necessity because people are going out less. Obviously, everyone needs clothes.
However, people don’t need to get the latest styles. This chart is important because it shows the back to school shopping season which is the 2nd biggest shopping spending season of the year. Clearly, the people not receiving benefits made up for those who are getting them. Let’s see how spending changes in late August and early September as the retroactive benefits go out.
Spending By Category
A second aspect of consumer spending worth following is where people are spending their money. It seems like some of the weakest areas have gotten a bounce and some of the strongest areas are trailing off. If you bought outdoor sports equipment in June for the summer, you don’t need to buy more of it in August.
If you bought an iPad to work from home in May, you don’t need to buy another one in the fall. Spending was pulled forward. On the other hand, people are excited to go out to eat and shop once restrictions are eliminated.
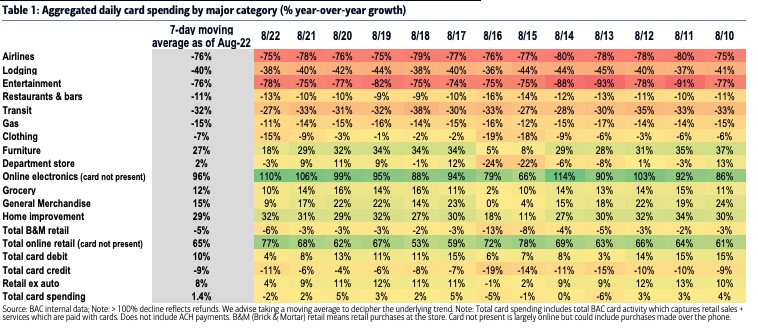
The chart above shows the Bank of America spending data in various categories in the past 12 days. 7 day average in spending growth on online electronics was 96%, while the spending growth at restaurants was -11% and the growth in spending on clothing was -7%. This doesn’t jive with my previous points about a mean reversion in spending in various categories. That thesis is based on July retail sales.
Also keep in mind, that we haven’t seen the economy fully revert back to normal. As COVID-19 deaths fall, we will see mean reversions. When people book more vacations, they will spend more on clothes. To be clear, spending on clothes as a percentage of overall spending is in a long term downtrend. However, spending isn’t going to fall at the same rate that it fell at during the worst of COVID-19.
Banks Are Being Hurt By Credit Losses
Banks are bearing the brunt of the recession as they have had spikes in credit losses similar to the financial crisis. As you can see from the chart below, quarterly loan loss provisions were above $60 billion in Q2. The peak was slightly above $70 billion in Q4 2008. If this cycle follows along the track of previous recoveries, we may have seen the peak in loan loss provisions. That would make now a good time to buy the banks.
Some banks are trading as cheaply as they did during the financial crisis even though they are in much better shape. Money made from PPP loans, the boost in deposits, and the increase in mortgage lending have helped the banks. If loan losses fall in the 2nd half of the year and the yield curve steepens further, this could be one of the best environments for the banks.

Individual Investors Love This Market
Individual investors love the stock market more than they have had at any point since the late 1990s. That’s a sign of a late cycle rally. While the economy is in the early part of this recovery, the cycle of growth stocks outperforming value stocks is near its end. We can easily have a strong recovery in the next 6 months, while the overall stock market index lags because tech brings it down. The chart below supports my point that retail traders love stocks.

Trading by individuals is a greater percentage of market activity than any time in the past 10 years. During the first 6 months of 2020, retail investors accounted for 19.5% of shares traded which is up from 14.9% last year and about double the level in 2010.
Right after the 2007-2009 bear market ended, there were stories about how retail investors might never get involved in stocks again. We have gotten far enough away from that nasty bear market that now people are willing to take risks again. They were inspired by the March crash because buying the dip worked out well.
Conclusion
A decline in unemployment benefits hurt spending from those on benefits as you’d expect. Let’s see if they are boosted by the retroactive benefits that are going out now. Banks were hurt by the recession, but they are being helped by PPP lending, the spike in deposits, and the increase in mortgage lending.
Retail investors are in love with this market which is dramatically different from the early recovery days in 2009 and 2010. It’s closer to the late 1990s even though we already had a recession