Turkish Crisis - Stocks Selloff On Monday
Although I mentioned in a previous article emerging market weakness could be a catalyst which helps cause the American economy to decelerate in 2019, I think the Turkish crisis is being used as an excuse for an overbought market to selloff. The S&P 500 declined 0.4% and the Russell 2000 was down 0.68% on Monday.
The VIX was up 12.31% to 14.78. Volatility has re-appeared as the market exited the 2017-like trance where stocks levitated higher with no hiccups. The CNN Fear and Greed index has fallen from greedy to neutral as it is at 55 out of 100.
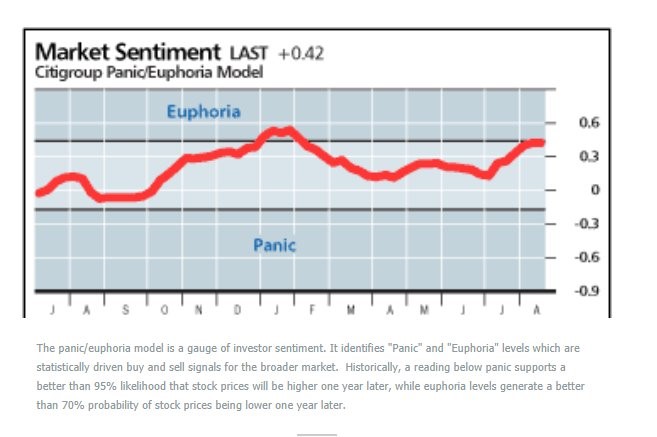
This wasn’t the only model which showed stocks were overbought. As you can see from the chart below, the Citigroup Market Sentiment Index tagged euphoria two weeks ago. At the peak, I expected a 3% pullback. The market is down 1.3% since then. As I mentioned previously, the further the market falls, the more it will look like this was a failed attempt at reaching the record high.
There was no economic data reported on Monday and few earnings reports. Previously, I mentioned this dearth of information would be good for stocks, but now it looks bad because the Turkish events are the only thing making headlines.
In this Turkish decline, the energy sector was the hardest hit as it was down 1.22%. Oil fell 43 cents to $67.20 on worries about demand as the tariffs threaten to slow the economy. Utilities were the best performing as they were up 9 basis points in a slight flight to safety trade.
Turkish Crisis - Lira Crashes
To be clear, the Turkish crisis is small part of the global economy. It’s so small at only 12 of the MCSI All World Index’s 1,426 holdings are from Turkey. They only make up 5 basis points of the index. The Turkish lira fell to an all-time low of $7.24 versus the dollar; it closed at $6.99.
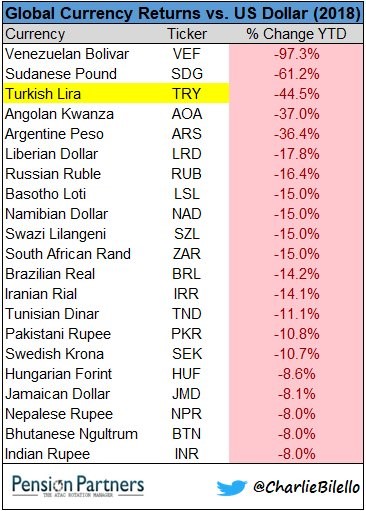
As you can see from the chart below, the Turkish Lira is down 44.5% year to date, making it one of the worst performing currencies in the world. The Venezuelan economy, which experienced hyper inflation and an economic collapse, has seen its bolivar fall 97.3% versus the dollar. The Turkish ETF fell 11% on Monday and the Vanguard ETF for emerging markets fell 1.61%.
Turkish situation - Europe Unstable?
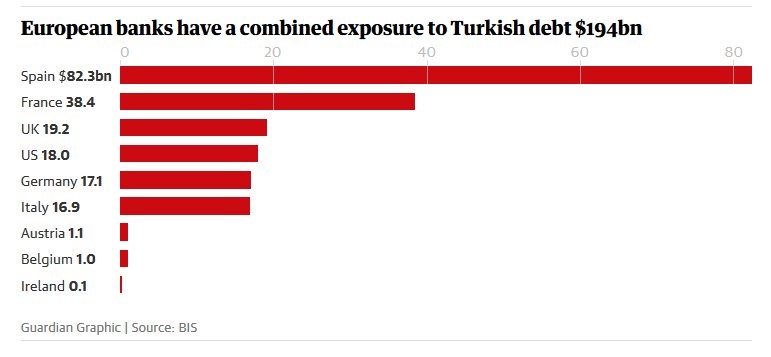
The normal question whenever there is economic instability is how it will affect Italy and the EU currency bloc. The chart below shows Spain has by far the biggest exposure to Turkey as its banks have $82.3 billion in exposure to its debt.
Luckily, the unstable Italy has only $16.9 billion in exposure to Turkish debt. UniCredit stock fell 2.58% to its lowest price since April 2017. The beleaguered Deutsche Bank had its stock fall 3.13%. It doesn’t need much to crash as worries about its stability occur even without a catalyst. Credit Suisse stock fell 1.77%. Banco Santander fell 2.89% which makes sense given Spain’s exposure to Turkish debt.
Turkish Crisis - Dollar & Treasuries
The dollar index was up 1.2% on Monday because of the flight to safety created by the Turkish crisis. The Turkish crisis will pass, but the strong dollar will be a big issue for firms with a big overseas presence. The dollar index is up 3.44% year over year, which isn’t much. The comparisons will get easier in January 2019 if the dollar index maintains this uptrend.
The 10 year bond yield was actually up 1 basis point to 2.88% which I was surprised by because it was a ‘risk off’ day. The 2 year yield also increased 1 basis point to 2.61% which means the difference between the two yields remained 27 basis points.
The treasury market wasn’t affected by the Turkish crisis, but it still implies the economy will see weakness. The Fed funds futures show there is a 62.2% chance of 2 more hikes this year (September & December). That isn’t the highest we’ve seen as the Fed funds futures market has followed the stock market. A decline in stocks means a lower chance of 2 rate hikes.
The September one is locked in at 93.6%, but the December one will depend on the economic data and markets.
Failed CBO Projections
The Fed and government are known by the bears to be too optimistic right before recessions, but the recent historical data shows the Fed and CBO have actually been too pessimistic. The Fed’s unemployment rate projections have been too high. The rate has unexpectedly fallen to 3.9% in July.
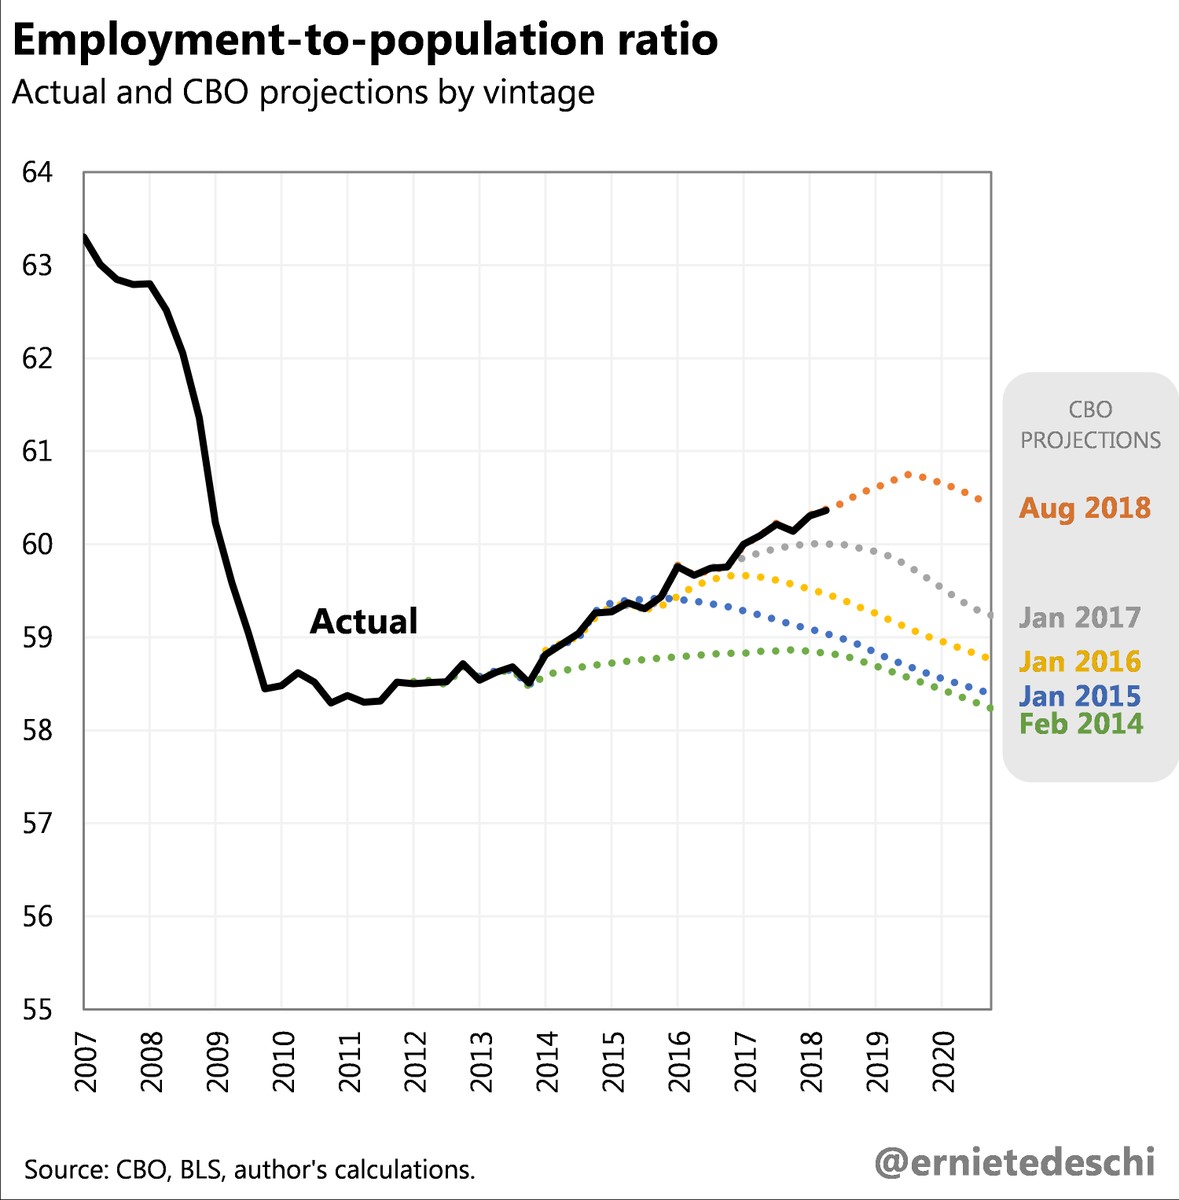
As you can see from the chart below, the CBO’s projection for the employment to population rate in February 2014 ended up being about 1.5% too pessimistic. The CBO believed there wouldn’t be a recovery in this stat. The demographics are working against this metric, but improvement in the labor market is helping it overcome that.
GDP Updates
As I mentioned on Thursday, the Atlanta Fed GDP tracker expects 4.3% growth in Q3. Let’s review the other trackers to see if the 10 year bond yield and the ECRI leading index are correct to be negative on future growth.
The CNBC rapid tracker expects growth to be 3.4% after 9 estimates are averaged. The range is tight as it is in between 3.4% and 3.5%. Only the St. Louis Fed Nowcast is in between that range as it is at 3.42%.
The NY Fed Nowcast, which has been negative in the past few months, expects only 2.57% growth. That is a one basis point decline; the disappointing PPI-FD report catalyzed this This Nowcast was the most optimistic on June 1st when it was at 3.01%. It will be interesting to see of this Nowcast is wrong again.
Conclusion - Turkish Crisis as it Relates to U.S.
The Turkish crisis isn’t relevant to U.S. equities. This would have been an opinion with 100% approval 2 weeks ago, but now there is worry as the S&P 500 is down 1.3%. It’s interesting to see investors changing their minds because of action instead of new facts.
The market could decline further. Buy stocks if there is a swoosh lower on this news.