Treasuries - Modest Decline In Stocks Big Rally In Treasuries
Treasuries - There's a problem with anyone saying treasuries are knocking stocks down. Low yields aren’t causing stocks to fall. Instead, the same catalysts, such as declining economic growth, that cause bond yields to fall are causing stocks to fall. Keep in mind, that there has been a 40 year bull market in treasuries and stocks have increased since then.
Looking more closely, this year stocks have done amazingly and yields have fallen. Also, lower rates mean less competition for stocks. Would you rather put your money in a savings account yielding 2% or take more risk with the stock market and potentially earn double digit returns? That math would have changed if rates kept climbing. But now it looks like we will be stuck in a low yield environment for longer.
The yield curve will affect the economy and the stock market, but not for a few months at least.
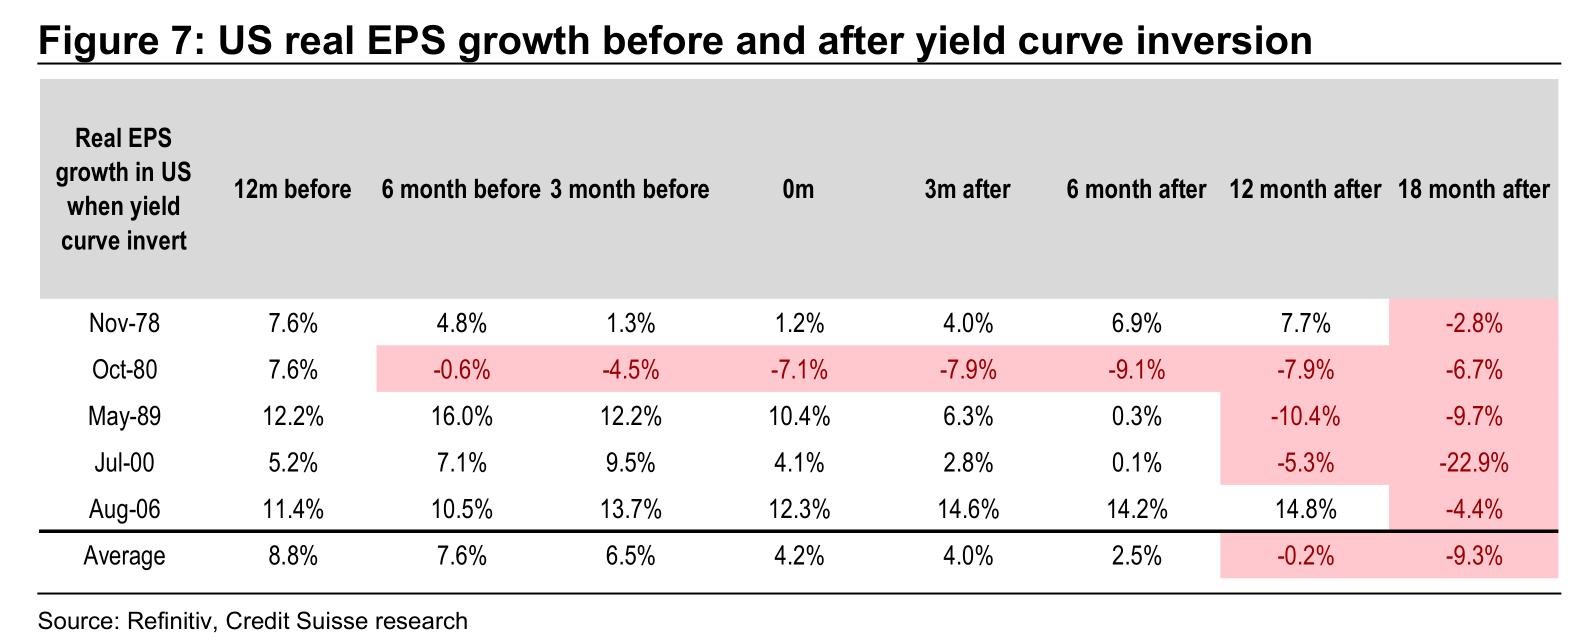
As you can see from the table below, on average real EPS growth in the past 5 cycles is positive until the 1 year mark after the curve inverted. The big challenge begins at the 18 month mark where the average decline is 9.3%. Obviously, this doesn’t include the yield curve inversion in 1998 when a recession didn’t follow soon afterwards.

Specifically, on Wednesday S&P 500 fell 0.46%, and Nasdaq fell 0.63%. Also, the Russell 2000 fell 0.39%. Every sector in the S&P 500 fell except the industrials which rose 11 basis points.
Industrials were modestly helped by Boeing which rose 1.03%. It released software fixes for its 737 Max plane which had two crashes in the past few months. Worst 2 sectors were healthcare and energy which fell 0.81% and 0.7%. There weren’t many big winners and losers because this was a uniform modest decline.
Treasuries - More Yield Curve Talk
The biggest topic in finance and economics has been the yield curve for the past few weeks. That’s after it was a big topic at the end of last year when the curve was flattening. Personally, I think these discussions about the yield curve forecasting a recession are all for naught. Most of the curve is still normal.
As you can see from the chart below, the percentage of the curve that has inverted isn’t close to the percentage before the last 4 recessions. This looks more like 1998 where most of the curve wasn’t inverted. But the parts of the curve followed the closest were. I’m not sure if the declining peak percentage of the yield curve that inverts before recessions means anything.
Investors favor this percentage approach over choosing one part of the curve because it gives us an overview of all treasuries. This percentage can easily spike.
At that point, I would cover the curve again and say a recession has a decent chance of occurring within 18 months. This about to be the longest expansion since the 1800s. But that doesn’t mean there will be a recession this year or next year.

Treasuries - Lowest 10 Year Yield Since December 2017
Investors are shocked by how low yields have gotten in the last few weeks. Personally, I’m going to be bearish on treasuries if the ECRI leading index shows positive yearly growth.
10 year yield has fallen to 2.36% which is below the Fed funds rate. 2 year yield has fallen to 2.19% because bond investors believe it is very likely that the Fed will cut rates this year. Specifically, the CME Group website shows there is now a 74.3% chance the Fed will cut rates in 2019.
This timing is very interesting because there are only 6 meetings left and the Fed hasn’t indicated it will cut rates. Fed is still calling for a hike next year. While I wouldn’t say that’s impossible, it is very unlikely.
Interestingly, there is now a 9% chance the Fed cuts rates at its meeting on May 1st. I think the odds are much lower than this. Fed has given no indication it will cut rates and the economy isn’t in dire shape. That being said, I could see these odds increasing to at least 20% sometime in the next few weeks after a weak economic report comes out. The economy is still in a slowdown which means weak reports are common.
Finally, it’s notable that the difference between the 10 year yield and the 2 year yield is 17 basis points which means during this period where parts of the curve have inverted, the spread between these two bond yields has increased. Unfortunately, my expectation for this spread to decline was incorrect. My forecast for the 2 year yield was much higher than where it ended up. This is one of the curves that needs to invert for the percentage of the yield curve that is inverted to increase.
Treasuries - GDP Nowcast Improves
Atlanta Fed GDP Nowcast improved from 1.3% to 1.5%. Keep in mind that even though the Nowcast was started on March 1st, this estimate is viable because it got a late start. This was because of the government shutdown. The model has most hard data from the first two months of the quarter and some soft data from all 3 months.
Nowcast increased because of the international trade report. It showed the deficit in January was $51.1 billion. That was down from $59.9 billion last month and below expectations for $57.3 billion.
A falling trade deficit usually is in tune with cyclical weakness in the economy. Exports increased 0.9% to $207.3 billion and imports fell 2.6% to $258.5 billion. Personally, I wouldn’t want imports to fall because it means consumption was weak.
Nowcast’s estimate going up because consumption fell isn’t ideal. Specifically, the estimate for net exports’ effect on GDP increased from -0.29 to 0.12%. The estimate for real non-residential investment growth fell from 2.2% to 0.2%.