

The dollar index traded a 14-point range in 2025.
The average is 8 points.
That's 66% wider than normal with higher highs and lower lows than the previous two years combined.
This kind of expansion doesn't happen randomly. It signals a reset. A new trend forming.
The dollar finished 2025 below the lows of 2023 and 2024.
The projected Monkeybars point to a potential drop to 90. That's another 10% loss in purchasing power.
Every major asset is quoted in dollars. When the dollar weakens, those assets rise. Gold proved this in 2025 with a 60% gain.
If the dollar loses another 10% in 2026, gold could reach $5,000 in the first quarter alone.
I'm going to show you exactly what the dollar is signaling, how it correlates to gold and commodities, and how to position your portfolio for what's coming.
What the Data Shows
The dollar finished 2025 below the lows of 2023 and 2024. That's not noise. That's a structural shift.
Looking at the projected Monkeybars for 2026, fair price sits near 95.73. The overbought zone falls between 100.20 and 103.20. Any bounce into that zone is likely a selling opportunity rather than the start of a new rally.
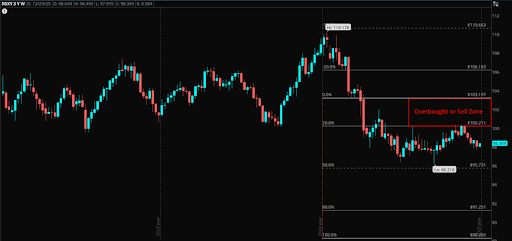
The downside target sits at 90. That represents a 10% drop in the dollar's purchasing power from current levels.
Why This Matters for Everything Else
Every major asset is quoted in U.S. dollars. When the dollar weakens, those assets tend to rise in dollar terms.
Gold proved this correlation in 2025.
The dollar broke its two-year support level the week of April 7. That same week, gold broke above $3,000 an ounce. When the dollar retested that broken support in November, gold pulled back and bounced.
The correlation is tight. And it's telling us something important about 2026.
The Gold Math
The expansion in gold's trading range tells the story:
- The average yearly range over the previous 10 years was under $400.
- In 2024, gold's range was two times greater than average.
- In 2025, that range expanded to five times greater than average.
Gold appreciated over 60% this year. Official inflation sits around 3.5% year over year. That means gold's move was roughly 20 times the inflation rate.
This is more than an inflation hedge. This is capital fleeing to safety.
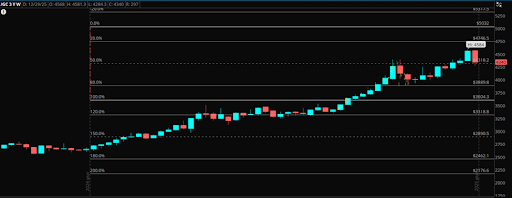
If the dollar loses another 10% in purchasing power in 2026, gold should see at least a 20% increase. The projected Monkeybars suggest a target near $5,000 in the first quarter.
The Stagflation Setup
A weakening dollar combined with persistent inflation creates a specific environment. Assets that benefit from inflation and stagflation should outperform.
That means gold, silver, and energy. It also means avoiding assets that suffer when purchasing power erodes. Cash sitting in a money market loses value every day the dollar weakens.
How to Position
The dollar weakness thesis suggests several actionable approaches:
- Long precious metals while the dollar remains weak. Any rally in the dollar toward the 100-103 zone is a chance to add to those positions on a pullback.
- Short dollar positions through futures or currency ETFs offer direct exposure to the thesis.
- Watch the correlation. If the dollar bounces and gold doesn't sell off, the thesis is even stronger. If both move in tandem as they did in 2025, continue riding the trend.
The dollar is telling us something. 2026 will reward those who listen.
In our next newsletter, I'll show you the sector I'm planning to fade based on this same top-down analysis. The setup has been building for six months and most traders are positioned exactly wrong.
Blake Young
Senior Market Strategist, TheoTrade