Momentum & Growth Dominate 2017
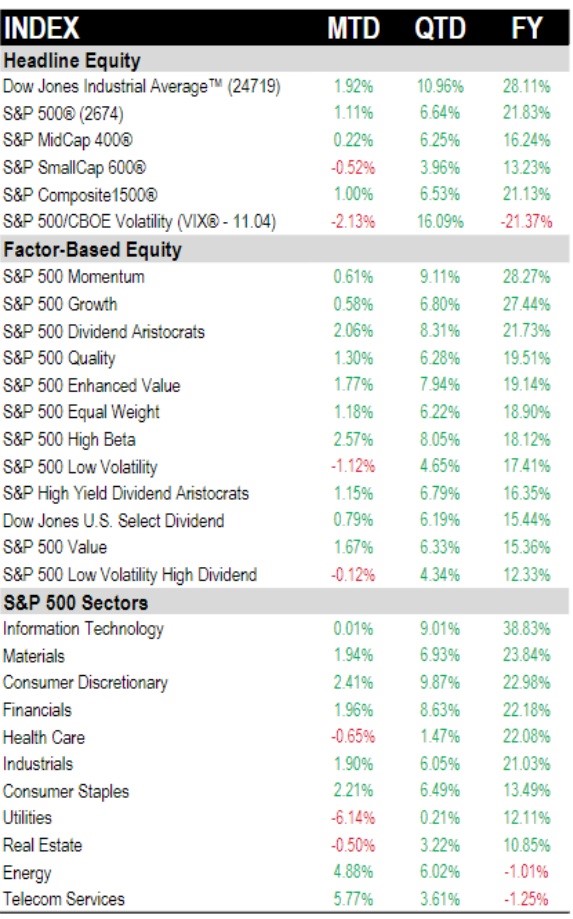
Since 2017 is now over, let’s look at the performance of various assets to get an idea of where they may be headed. The table below shows the month, quarter, and year performance of the headline indexes, various factor investment strategies, and each sector. Unsurprisingly, volatility was down for the year and all stock indexes were up in the 4th quarter and the full year. Looking at the factor investments, momentum and growth had the best year. This is something I touched on when reviewing the 19 signposts of a bear market. On the one hand, whenever there is speculation, these risky stocks will do well. On the other hand, at some point the speculation gets out of hand and there is a crash.
The American economy is currently riding a growth wave which is the strongest of this business cycle. However, when growth starts to get high, inflation is created which causes recessions. Even without a recession, if the financial conditions constrict from the loosest point since 1994, we may see a reversal in this long growth and momentum trade. High beta stocks did the best in December. That probably is the result of the commodities rally because many of those stocks are highly volatile. As you can see, the value and low volatility high dividend factors had the worst year. When the market is in a ‘risk on’ mood, these consistent stocks get pushed aside as investors want to press their luck in names like the FANG stocks.
Tech, materials, and energy were the 3 sectors which had earnings growth outperform the S&P 500. As expected, the tech sector had a great 2017 as it was up 38.83%. It’s interesting to see that, despite the rally in oil and the fact that energy earnings were up the most in 2017, the sector was the 2nd to worst performing one in the S&P 500 as it was down 1.01%. It’s possible that the rally in these stocks in 2016 fully priced in the increase which in oil and their earnings in 2017. Materials also had great stock performance as the sector was up 23.84%.
International Equities Shine
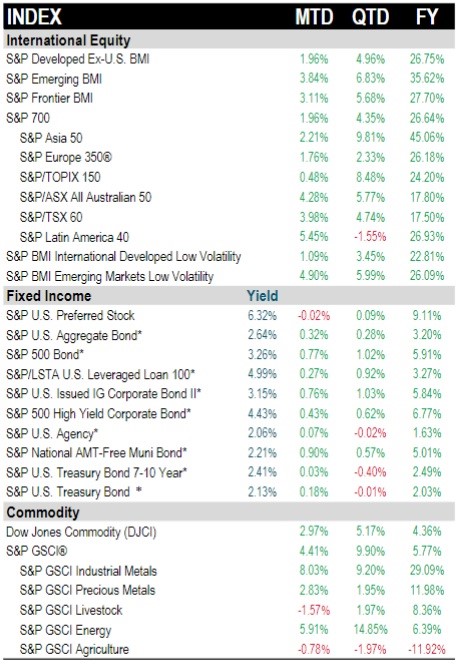
2017 was the year where emerging markets regained their momentum as Brazil exited its depression and China finally had the soft landing economists have been discussing for years. The table below shows the international stock, fixed income, and commodity performance by the month, quarter, and year. As you can see, it was a great year for stocks across the board. Emerging markets were up 35.62% in 2017. The best region was Asia which was up 45.06% in 2017.
In terms of fixed income, the best performing groups this year were the riskiest as the S&P 500 high yield corporate bonds were up 6.77% in 2017 and U.S. preferred stocks were up 9.11%. Commodities didn’t have a great year considering the global growth improvement and trade growth acceleration. I take the improvements in emerging markets to be a signal that commodity prices will go up more in 2018. As you can see, the Dow Jones Commodity index was up 4.36% in 2017. The best group was industrial metals, like copper, which was up 29.09%. The worst group was agriculture which was down 11.92%.
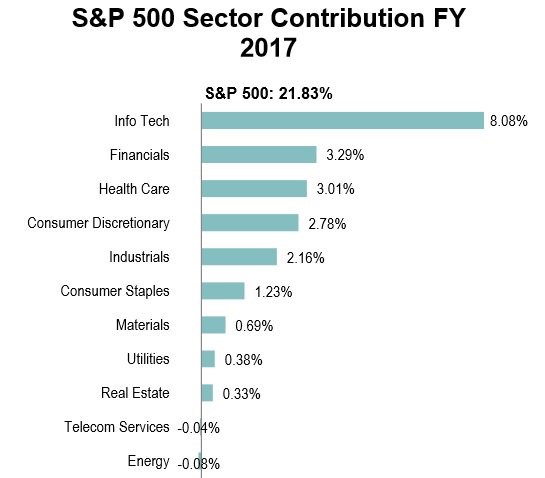
Sector Contribution To The S&P 500
The S&P 500 total returns are up 14 straight months which is a record. The chart below reviews which sectors drove the 21.83% this year. Because tech is the biggest sector and had the best returns, it was responsible for the most returns by far. Energy had a big impact on the S&P 500’s earnings growth, but it had no impact on the price action. I’m looking for that to change next year as commodity inflation heats up. This market certainly lives and dies with technology. Whichever global market had a high weighting in tech this year did well, while the markets with a low amount of tech underperformed. Analysts are expecting tech earnings growth to have a moderate deceleration as the other sectors (excluding materials and energy) pick up the slack. This market lives and dies with tech. I consider that to be great because they have secular tailwinds, such as the advancement of the internet, working in their favor. When energy and commodities outperform, it signals the economy is near a recession. When utilities, value, consumer staples, and low beta do well, it signals the economy is in a recession.
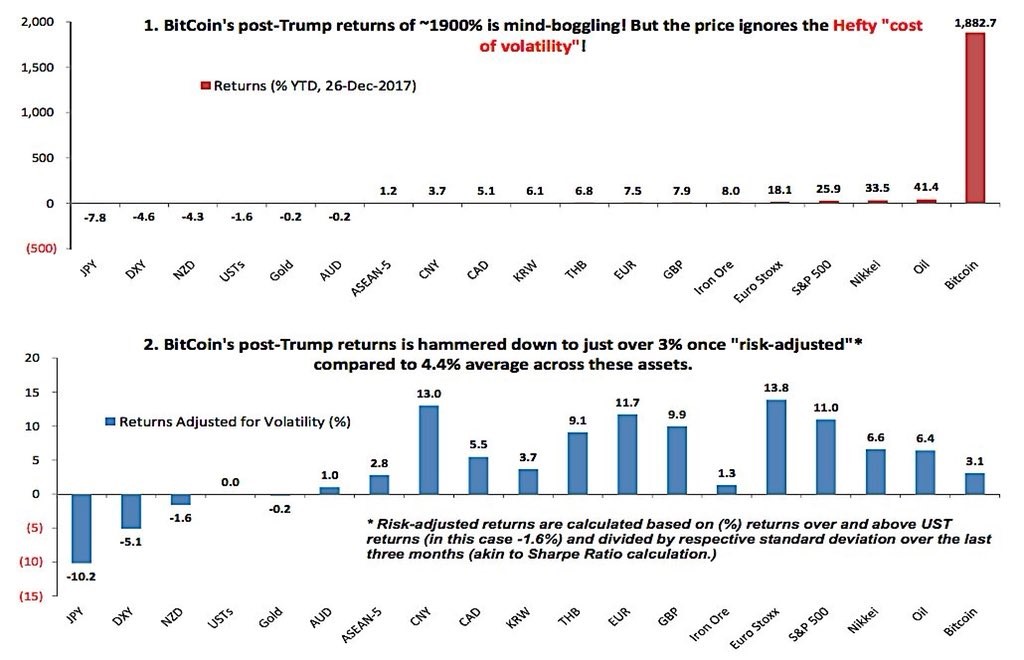
Bitcoin Ends The Year On A Sour Note
Bitcoin has been plummeting in the past two weeks. It peaked at $19,600. Now it’s at $13,800. My opinion that the peak in December will stand as the highest point for years has stood the test of a few days. However, bitcoin’s immediate term demise hasn’t led to the collapse of the entire crypto space. The total market cap of cryptos is $606 billion. Bitcoin’s dominance has fallen to 38% this is a few tenths of a point away from the lowest dominance ever. This is because Ripple has had a meteoric run. It was up 78% on Friday. It is now the 2nd largest cryptocurrency. It went from a market cap of $37 billion on December 24th to a market cap of $111 billion on December 30th. This might be the last hurrah for the crypto speculation. Ethereum and bitcoin had their giant rallies. Now it’s ripple’s turn. It’s questionable how many more cryptocurrencies will explode like these have. Eventually people will get burned trying to find which horse to ride and this speculation will end. The money looks to have come out of bitcoin and into ripple this week.
Anyone who has FOMO about bitcoin can look at the chart below to ease their desire to speculate in the currency. As you can see, when you adjust for volatility bitcoin is only up 3.1% since the presidential election. Volatility sounds immaterial now because of the increase, but when it goes in the other direction, people will feel the wrath of taking more risk than they can handle.