Huge Sector Rotation Back To Momentum
Monday had a massive swing back to the momentum tech stocks that were hurt last week, which is why last week’s decline was meaningless. Just because we had bubble-like activity followed by a decline doesn’t mean the rally is over. That’s what makes market timing difficult.
If we could just follow the media’s suggestion that this may have been the peak, we’d all be rich without needing to do research. To be clear, we are at an extreme level. More parabolic this rally gets, the deeper the downside will be.
At this point, the parabolic move is already in. If you are a bull, you should root for tech to go higher because there’s no way this ends well. Final leg of the rally will be the strongest. It was shocking to see tech do so well on Monday because the Oxford vaccine had promising news and it’s clear we are very close to a peak in new national COVID-19 cases.
There were 62,879 new cases on Monday which is below last Monday which had 65,789 new cases. Normally, that would send the work from home stocks down, but that wasn’t the case. CLOU ETF was 4.96% as Shopify and Twilio were up 8.76% and 10.23%. Twilio is up 21.6% in the past month and 267% since the March bottom.
These crazy numbers sound like the late 1990s. Big cap stocks also rallied as Tesla was up 9.47% to a new record high. It now has a $305 billion market cap. Out of the money Tesla call options have extreme volume. Normally, no one would invest in such way out of the money options because it would take extreme buying to get the stock there. In this parabolic market, anything goes. Amazon was up 7.93% as it almost completely reversed its 5 day losing streak.
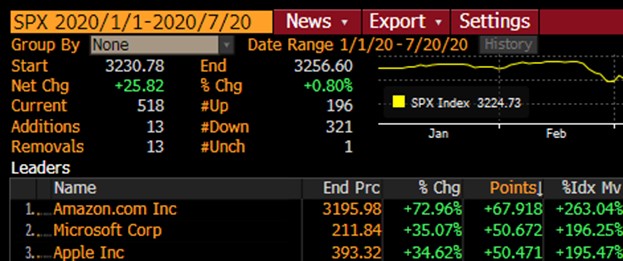
As you can see from the graphic above, Amazon represents 263% of the S&P 500’s rally this year. That’s because the S&P is only up 0.65% year to date. Even still, Amazon’s run has been historic. It is up 73% year to date while 320 stocks in the index are down year to date. Investors who care about history will be talking about the FANG stocks in the future like we talk about the nifty 50 of the 1970s.
Tech Bubble Numbers
There are a bunch of crazy numbers on the Nasdaq and the big internet names. For instance, the Nasdaq 100 is 21% above its 100 day moving average which is the widest gap since March 2000. The gap reached almost 40% at the peak in the tech bubble, so maybe we have more to go. Top 6 companies in the Nasdaq are 49% of the index.
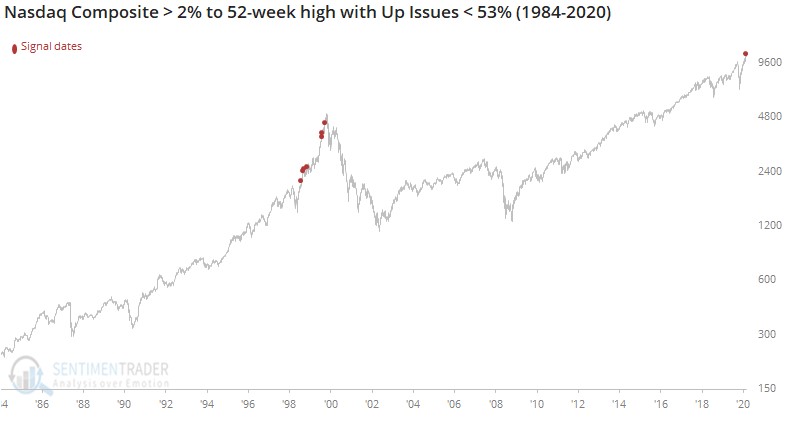
On one side, you have 6 companies and the other you have 3,294. Nasdaq composite was up over 2% and reached a 52 week high today. As you can see from the chart below, red dots are listed when this occurred and only 53% of the index rose. Last time this happened was in February 2000. It happened 6 times from 1998 to 2000. We are in rarified territory, but not necessarily the top.
Crazy Bad Breadth
Again, the market had really bad breadth on Monday. 8 sectors fell. As you’d expect with a big internet rally, the only sectors that rallied were tech, communication services, and consumer discretionary. Amazon is more than half of consumer discretionary which means most discretionary stocks actually fell.
S&P retail index was down 0.64%. Energy fell 1.73%, while consumer discretionary rose 3.14%. Only one other time has the S&P 500 increased more than 50 basis points while 8 sectors fell. That was February 23rd, 2000 which was right before the tech bubble burst.
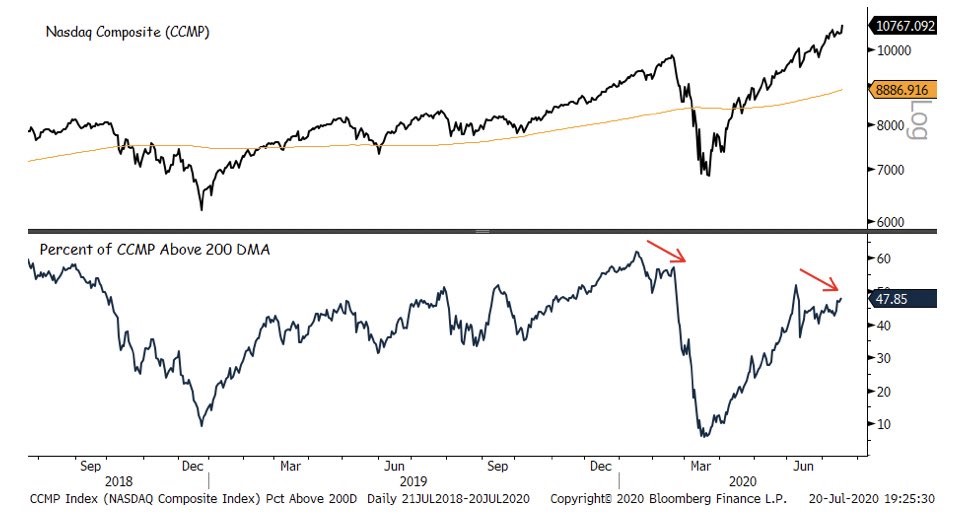
These one off statistics, are becoming so common and the rally has gotten so strong, you can’t ignore them. The chart below shows about 52% of the Nasdaq is below its 200 day moving average. Tech isn’t doing well, let alone small cap value. Specifically, the Russell 2000 value index was down 1.6%. Regional bank index fell 1.8%. Small cap value stocks will always fall if energy and regional banks are down.
Since 1996, there have only been 254 days in which the Nasdaq was up 2.5% or more. Only 12 of those had worse breadth than Monday. All 12 happened from December 1998 to March 2001. The Nasdaq 100 was up 2.9% and the equal weight S&P 500 was down 0.5%. Last time that happened was April 2001. Since 1962, there have been 5 days in which the S&P 500 was up 0.75% or more and there were more decliners than advancers on the NYSE.
All but one of those days were in 2000 and 2008. Finally, the S&P 500 tech sector has gone 91 days without a 3 day losing streak. That only happened one other time since 1989. It was in 2004 in which the tech sector then fell 14.7%. It’s crazy how that never even happened in the late 1990s.
Bad Habits Have Been Formed
On Robinhood, Apple, Microsoft, Tesla, and Amazon are the 6th, 7th, 9th, and 13th most popular stocks. Bad habits have been formed. Almost all value investors are gone from the market. It is controlled by growth investors as they have control of almost all the capital. Bad habits have been rewarded.
Best performing investors have bought the dips on big cap growth stocks even though their valuations are crazy. There is no one with substantial capital left to fight this trend. That means we are near the end of this multi-year explosion in growth stocks. No one can predict the exact day this will end. Timing is everything because if you short Shopify a few days before its ultimate top, you will potentially lose 30% or more. Shorting these stocks is playing with fire.