Decent Empire State Index
As I mentioned in a previous article, earnings reports are coming out rapid fire, which means some of my economic analysis is delayed. I’ll now review two of the economic reports from last week. Firstly, let’s look at the Empire Fed Manufacturing report. The manufacturing economy was strong in June. The July regional Fed reports will tell us if the manufacturing sector will return to the February peak or fall lower, indicating the strong first half won’t continue. I have been expecting weakness for a few months, but there has actually been a plateau in the sector.
The headline Empire State index was 22.6 which beat the consensus for 22, but was lower than last month’s report of 25. This supports the point that growth won’t be as strong as June, but ultimately it’s still not bearish; it’s a sign of a continuation of the plateau. Besides just looking at the headline number, we want to see if there is stress in the supply chain. If there is stress, that means there will be inflation and demand is too hot. If there isn’t stress, growth is sustainable. It’s better to have sustainable growth than a great headline number that can’t last.
This report was good in the sense that there was less stress on the supply chain as the unfilled orders index fell from 9.3 to 0. Furthermore, the delivery times index fell from 13.2 to 6.0. This means delivery times are increasing, but at a slower rate for more businesses. The work week length increased at a slower speed for more businesses than it did in June as well as the index fell from 12.0 to 5.6. The input costs index is probably the best reflection of sustainable growth as the index fell from 52.7 to 42.7.
Every single current indicator fell, including new orders which went from 21.3 to 18.2. It would be great for the index to stay at this level permanently, but there are worries this weakness in rate of change terms continues. The biggest worry is that manufacturing follows global weakness lower since manufacturing is more in tune with the global economy than services. The decline in the shipments index from 23.5 to 14.6 may have been because of the draw down in raw materials inventories.
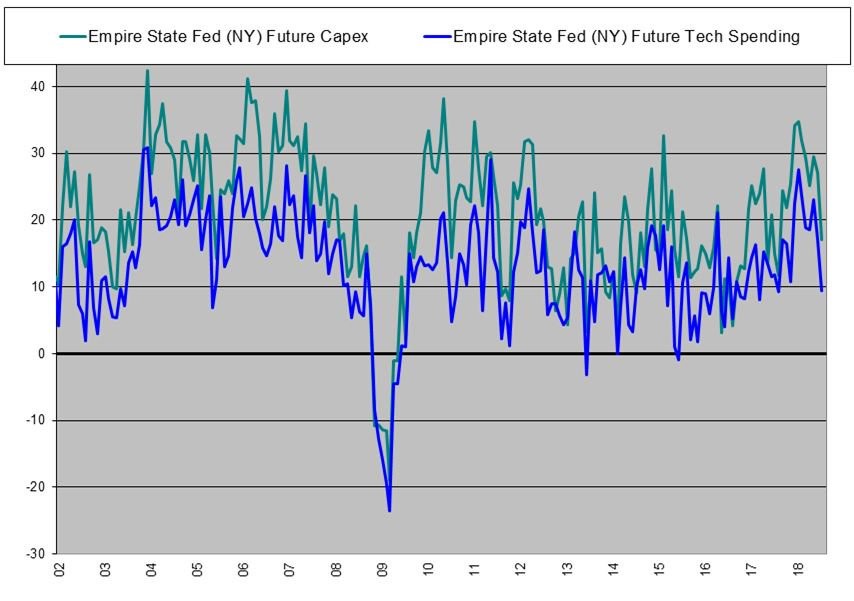
The future expectations indexes had some improvement unlike the current indicators. The future new orders index increased from 33.4 to 37.2. This continues the past few months of improvement after there was a sharp decline earlier in the year. The expectation for prices paid fell from 51.2 to 48.7. This is still very high, but there have been a few months of modest weakness, which could signal a deceleration in inflation. One of the major takeaways from this report was the decline in expected capex and technology spending seen in the chart above. The capex index fell from 27.1 to 17.1 and the technology spending index went from 17.1 to 9.4. The chart shows that this sometimes means there is economic weakness, but many times it is just noise. One reason this is surprising is because capex has been up a lot because of the tax cut.
Strong Industrial Production Snap Back
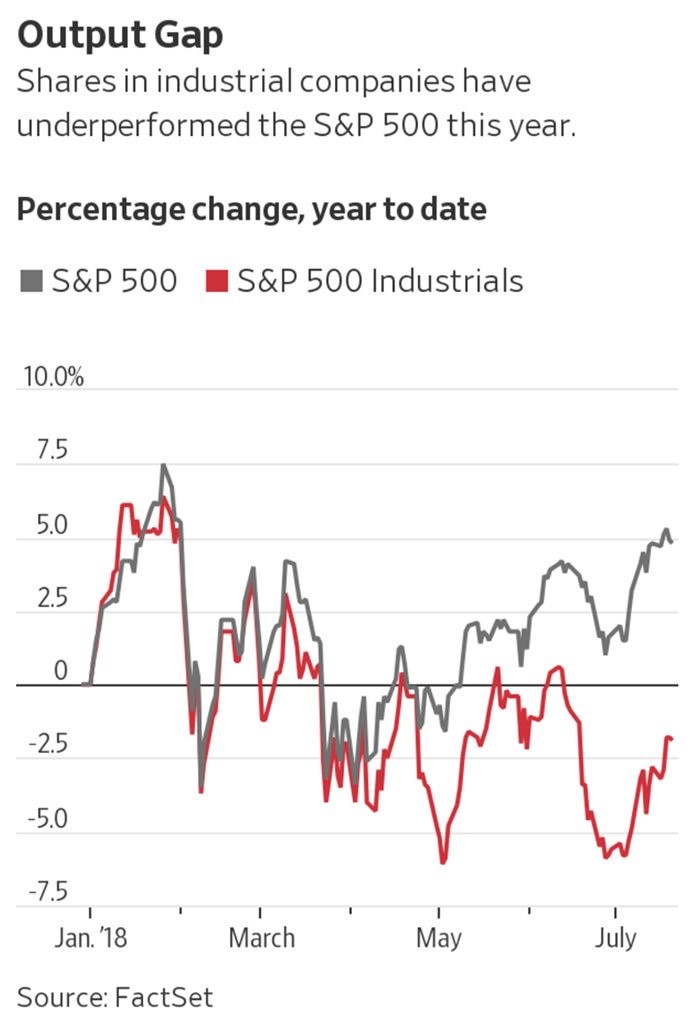
The industrial production report is the most important report for the manufacturing sector because it is a hard data report. As you can see from the chart below, the industrial stocks have been lagging the overall market year to date. The biggest underperformance came from late April to early May and late June. The sector has been hit by the trade worries and the underperformance in many international economies such as China, Europe, and Japan. This underperformance hasn’t been in tune with the industrial production reports as the June report was strong. One other point about this chart is that the output gap is traditionally the difference between economic growth and potential growth, not the S&P 500 versus the industrial sector. I’m just explaining this to avoid any confusion about the title.
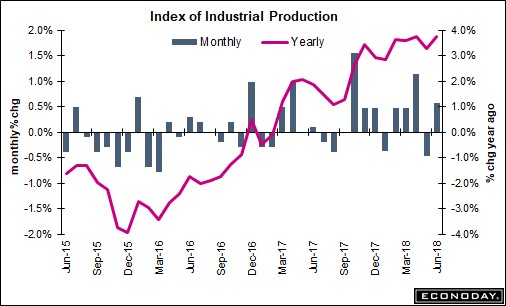
The June industrial production report was strong across the board, which is good news for this Friday’s GDP report. As you can see from the chart below, month over month production growth was 0.6% which met estimates and was above last month’s 0.5% decline. Manufacturing growth was 0.8% which met estimates and was much stronger than the 1.1% decline in May. The capacity to utilization rate was 78% which was below estimates for 78.3%, but beat last month’s 77.7%. The rate peaked at 79.6% in November 2014. The weakness since then has probably elongated this expansion. I think the final peak might be a bit high based on prior cycles. However, it’s also possible the downtrend in the cycle peaks continues and the rate stays below 79.6%. Either way, there is still room to run.
Delving into the details of the report, this was a snap back from the weak May report. The May report was impacted by the fire at an auto parts supplier plant. It’s possible GDP growth would have been close to 5% without that fire. Motor vehicle production increased 7.8% in June after May’s 8.6% decline. Hi-tech production was up 1.4% month over month. Mining production was up 1.2%, while utility production was down 1.5% because of the mild weather in June. It’s good to see the headline strength not relying on utility production growth, because that’s not discretionary.
Conclusion
It’s obvious the Q2 GDP report will be a blow out. At this point, anything below 4% would be disappointing. However, I’m also focused on a potential slowdown in the second half of the year. The industrial production report supported the narrative that Q2 GDP growth will be great. The Empire Fed index didn’t support the narrative that economic growth will be slowing soon. ECRI is strongly relying on weakness from next week’s PCE report to support its ‘growth slowing’ narrative, because I haven’t seen much weakness. One of the most negative aspects I can find is that analysts haven’t raised future earnings estimates. That’s a neutral indicator, not a negative one.
1 Comment
James Teh
July 25, 2018Thanks Bro Don for your information and support