Slight Decline In Philly Fed Index
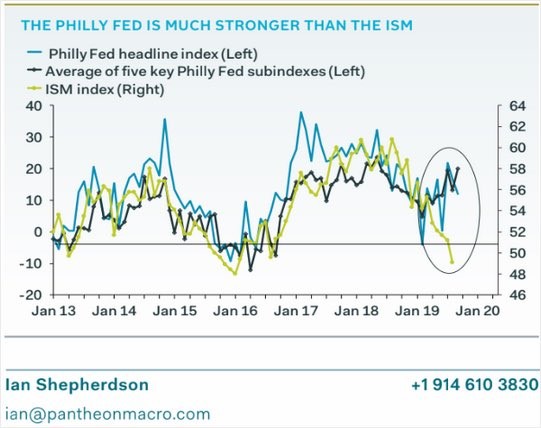
Philly Fed manufacturing index fell slightly just like the Empire Fed index. It went from 16.8 to 12 which beat estimates by 1 point. As you can see from the chart below, the Philly Fed index and the average of the 5 key indexes are way above the ISM index.
Yearly industrial production growth has been in line with the ISM PMI. Industrial production growth beat monthly estimates in August. But yearly growth was still weak. However, if monthly growth stays solid, yearly growth will improve because the comps will get easier.
Average of the 5 key indicators in the Philly Fed report are different from the index because the index is a weighted average. Specifically, the new orders index fell 1 point to 24.8. It’s still very strong.Shipments index rose 7.4 points to 26.4. Remember, the manufacturing hours worked category helped the August leading indicators index.
In this report, the employee workweek index increased from 6.8 to 13. Maybe that category will help the September leading index. Just like the Empire Fed report, the 6 month expectations index in the Philly Fed report fell sharply. It went from 32.6 to 20.8. 6 month expected new orders index fell from 44.1 to 35.2. Shipments index fell from 43.5 to 41.3. Unlike the Empire Fed index, capex index rose from 22.6 to 25.9.
A takeaway from this report is that the manufacturing economy is in a slowdown, but not a recession. Expectations may have cratered because of the trade war. I expect yearly industrial production growth to pickup modestly in late 2019 because of easier comps.
Strong Existing Home Sales
Economic reports have been beating estimates this week mostly because of the housing reports. August existing home sales report was no different from the others as it showed 5.49 million in sales which beat estimates for 5.3 million and improved from 5.42 million. This was the best report since early 2018. The housing market is being helped by the decline in rates.
Existing home sales report is the most important housing metric because most sales are older homes. They are cheaper and there are more of them. On Tuesday, the Case Shiller and FHFA home price indexes come out and on Wednesday the new home sales report is released. Will housing price growth finally stop falling?
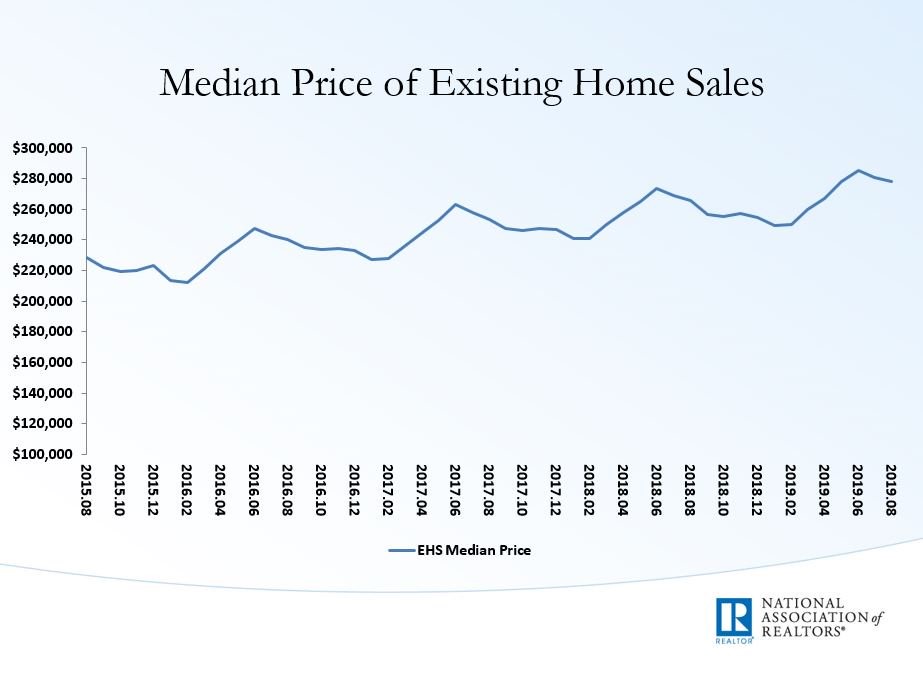
Monthly existing home sales growth fell from 2.5% to 1.3%, but yearly growth rose from 0.6% to 2.6%. As you can see from the chart above, the median existing home sales price fell slightly to $278,200, but yearly price growth was 4.7%. The inventory situation tightened which could increase prices further.
The supply of existing homes fell to 1.86 million. It fell from 4.2 months to 4.1 months. On a regional basis, the Northeast, Midwest, and South had monthly growth, but the West fell. On a yearly basis, the South was the best followed by the Midwest, West, and the Northeast.
Improved Leading Index Growth
Leading economic index’s growth rate rose and the coincident index’s growth rate fell. That’s a great trade off since investors are always forward looking. Personally, I usually don’t follow the coincident index. But I am now because I’m curious if this slowdown gets as bad as the last one in 2015-2016.
Yearly growth fell to about 1% in the first half of 2016. In the latest report from August 2019, growth fell from 2% to 1.8%. Growth is still falling, but the index actually hasn’t stopped rising. I see no evidence that suggests growth will go negative this year. It might fall below 1.5% in Q4 though.
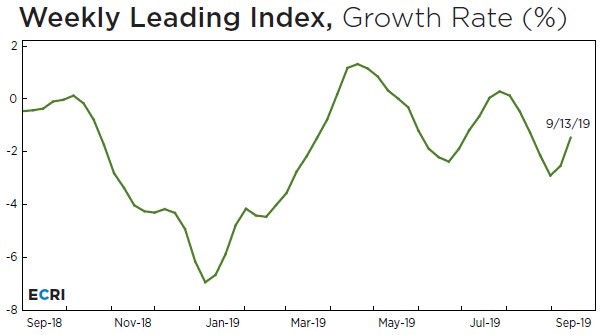
In the leading indicators report, in the past 6 months the coincident index grew at double the rate of the leading index. In the ECRI report, the coincident index is also outperforming the leading index. The good news is the leading index’s growth rate has been improving as you can see from the chart below. Yearly growth improved from -2.5% to -1.5%. That’s a solid improvement because the comp wasn’t that easy.
This index rose from 144.8 to 146.7. That growth rate recently troughed at -2.9% in late August. The stock market’s rally in September has helped the index. I have no doubt that the yearly growth rate will be positive in all of Q4 because the comps will get much easier. That’s why I will focus on the index itself starting in October. A takeaway from this reading is the economy should have near trend growth in the first half of 2020. I’m expecting the slowdown to end in early 2020, but I’d like more support in the data before I’m confident in that projection.
NY Fed Nowcast Isn’t Bearish Anymore
CNBC rapid recap shows as of September 19th, the median Q3 GDP growth estimate was 2%. I don’t think the average estimate improved enough based on the data. Personally, I agree with the NY Fed Nowcast which now is bullish on Q3 growth since it’s above the consensus.
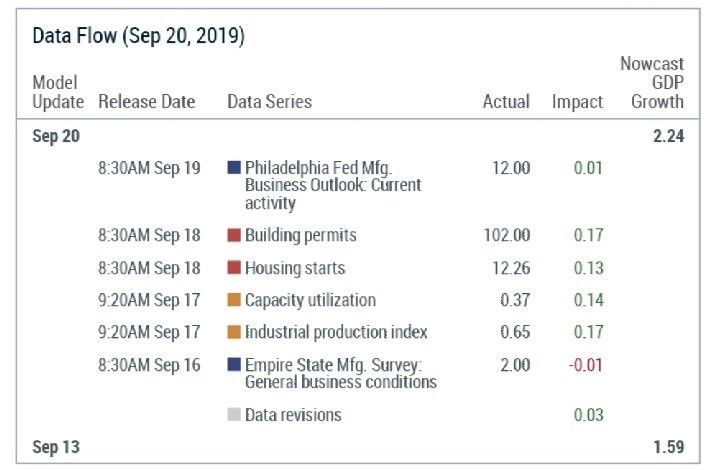
As you can see from the table below, the Nowcast improved from 1.59% to 2.24%. Building permits and housing starts helped the estimate by 0.3% and industrial production and capacity to utilization helped growth by 0.31%. CNBC rapid recap shows those data points helping growth by just 0.1%.
It will be interesting to see what the Atlanta Fed Nowcast shows in its update on the 27th. An uber-bullish St. Louis Fed Nowcast now expects 3.02%. I think growth will come in between 2% and 2.5%. That’s a solid reading for a slowdown.
Conclusion
This was a good week of data as the existing home sales report beat estimates just like most other recent data points. This caused the NY Fed GDP Nowcast to project 2.24% Q3 GDP growth. At this point in the quarter, most of the hard data is in.
All the Nowcasts are very accurate. There’s no indication the GDP report will be recessionary. This is still a slowdown though, as the coincident indicator shows only 1.8% yearly growth. At least the ECRI leading index isn’t problematic as yearly growth is barely negative. Yearly growth has been hovering around zero for much of 2019.