Stocks Selloff - Hawkish Fed Pushed Stocks Lower
Stocks Selloff and fell modestly on Friday because the Fed took the 50 basis point rate cut off the table. Fed is lucky the stock market hasn’t reacted that much to the wild swings in the Fed funds futures market.
S&P 500 and the Nasdaq had their worst weeks since late May. Which isn’t saying much because stocks have rallied since the end of May. S&P 500 and Nasdaq fell more than 1% and the Dow fell 0.6% on the week.
On Friday, S&P 500 fell 0.62%, Nasdaq fell 0.74%, and Russell 2000 fell 0.5%.
Investors Modestly Optimistic
Stocks Selloff - VIX spiked 6.8% to 14.45 which is a relatively normal level. CNN fear and greed index is in the fear category as it fell 3 points to 44. Even though that index is showing fear, sentiment readings show there is some excitement among investors.
In the AAII investor sentiment survey in the week of July 17th, the percentage of bulls rose 2.3% to 35.9%. That’s still below the historical average of 38.5%. Good news for stocks is the percentage of bears also increased 1.1% to 28.6%. That's below the long run average of 30.5%. Both the percentage of bulls and bears were able to increase. Neutral reading fell 3.5% to 35.4% which is still above the long run average of 31%.
As you can see from the chart below, the difference between the percentage of bullish and bearish advisors went above 40%. It’s near levels associated with tops in the market. Although there have been some false alarms as the yellow highlights show.

Stocks Selloff - Breakdown Of Friday’s Action
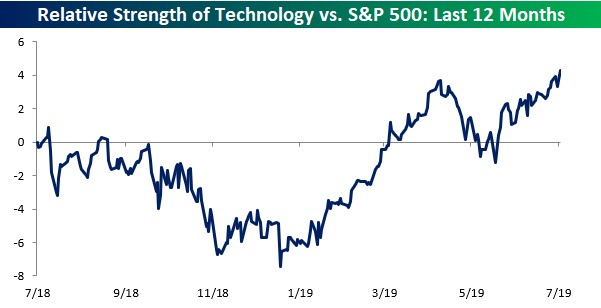
Only 3 sectors that were up on Friday were the industrials, energy, and materials which increased 0.46%, 0.25%, and 0.49%. Energy has underperformed the S&P 500 since June 2008. Ratio of the XLE energy ETF to the S&P 500 is at a 19 year low. Tech fell 0.55%.
As you can see from the chart below, in the past few months it has outperformed the S&P 500. Microsoft barely eked out a gain as it increased 0.15%. It’s now up 18 of the past 24 earnings reaction days.
2 worst sectors on Friday were the utilities and real estate which fell 1.45% and 1.69%. Even though Friday was a ‘risk off’ day, these sectors fell because the bond market sold off.
Odds of a 50 basis point cut fell because of the hawkish statements made by Bullard and Rosengren. This pushed the 2 year bond yield up 6 basis points to 1.82%.
10 year yield rose 3 basis points to 2.06% which means the curve flattened. The curve should be flat because the economy is late cycle. If it steepens, it would signal economy is in a recession. That’s not a proper assessment based on most economic data.
Big Improvement In Philly Fed Index
Stocks Selloff - July Philly Fed manufacturing index improved which suggests the ISM new orders index will increase. That would eliminate one of the negatives that hurt the June leading indicators index.
As you can see from the chart below, the Philly Fed general business conditions index increased from 0.3 to 21.8. That destroyed estimates for 4.5 and the high end of the estimate range which was 7. As you would expect from a report with such a solid improvement in the business conditions index, the underlying data was solid.
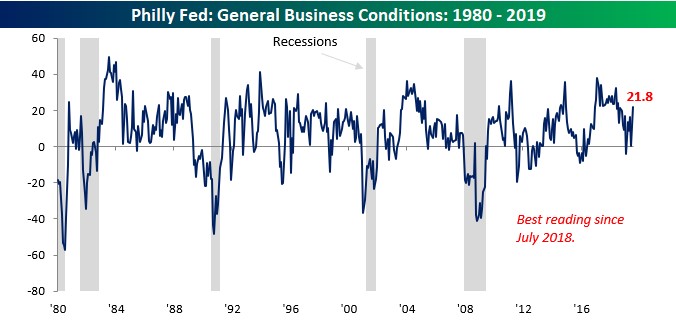
First let’s look at the special question in this report. It asked about the demand for firms’ manufacturing products in the past few months. 56.1% of firms stated demand has been increasing and just 31.6% said it has been falling. That doesn’t sound recessionary at all.
There's not much to worry about if the overall labor market is solid, real wage growth is increasing, and consumption growth is solid. And also if the manufacturing sector is doing fine. Regardless of what the leading indicators reading suggests.
Stocks Selloff - Manufacturing firms were spooked by the trade rhetoric in June; that’s it.
Yearly manufacturing and industrial production growth aren’t negative.
Looking at the details of this report, the new orders index increased from 8.3 to 18.9. Remember, the new orders index in the ISM report was 50. I think it will improve to the low 50s in July.
Shipments index was up from 16.6 to 24.9. Remember how the Empire Fed report had a big decline in its number of employees index? This index almost doubled in the Philly Fed report as it went from 15.4 to 30.
Average employee workweek index more than tripled as it went from 7.3 to 23. Just like the current index, the 6 month expectations index was up significantly as it went from 21.4 to 38. New orders index went from 31.5 to 45.7. The capex index went from 28 to 36.9.
University of Michigan Index Improves Slightly
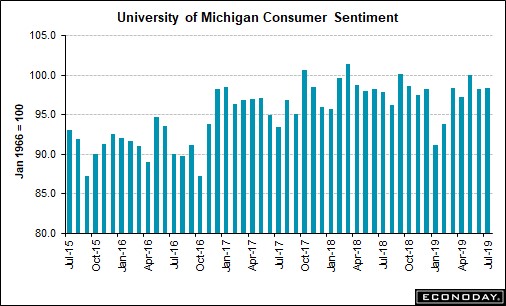
Stocks Selloff - Preliminary July University of Michigan consumer confidence index increased 0.2 to 98.4 as you can see from the chart below. That missed estimates by 0.2.
Current index fell slightly from 111.9 to 111.1 and the expectations index rose from 89.3 to 90.1. In the past 30 months, the overall index has been between 91.2 and 101.4. It is in the high end of that range now.
Expectations for inflation in the next year fell 0.1% to 2.6%. And expectations for inflation in the next 5 years fell 0.3% to 2.3%. In the past year, 5 year inflation expectations have been the same or below 1 year estimates.
Stocks Selloff - Conclusion
One of the main arguments the bears have made about the economy is being taken away as manufacturing sentiment is rebounding hard in July.
There are still 3 more regional Fed indexes left to report results for July. But the first 2 have shown improvements.
Consumer sentiment hasn’t budged much in the past 30 months. That didn’t lead to strong consumption growth in Q1. But consumption growth will rebound in Q2.