Stocks Have A Huge Reversal
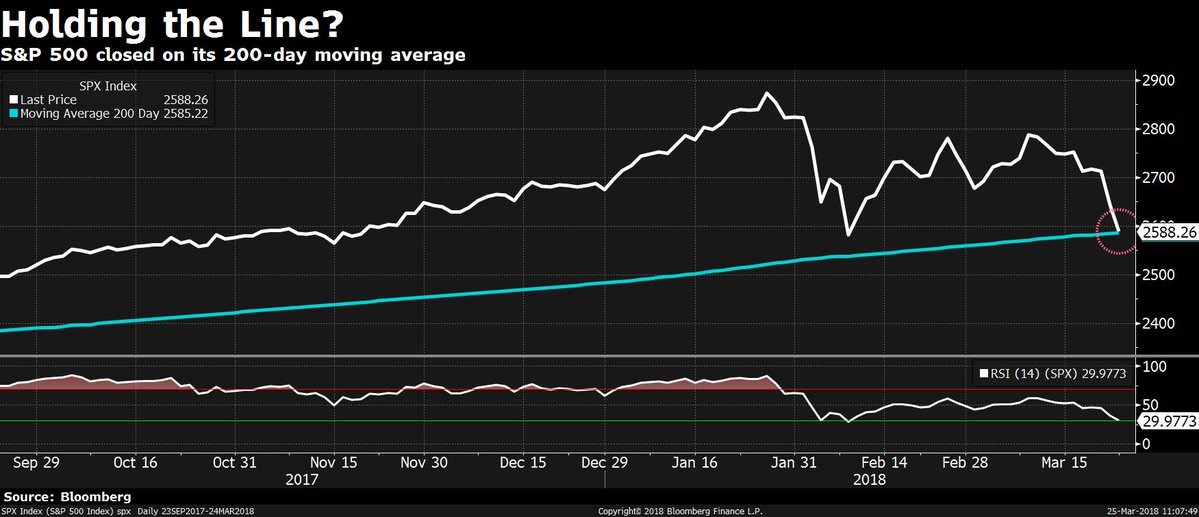
The stock market reversed sharply on Monday. The S&P 500 was up 2.72% as it bounced off the bottom of the recent range. As you can see from the chart below, it also bounced off the 200 day moving average which was hit on Friday. As I said last week, the stock market shouldn’t fall into a bear market with modest GDP growth and extremely strong earnings growth. The possibility of a trade war is a headline risk. Risk needs to be actualized before stocks fall 20%. The bottom part of the chart shows the 14 day RSI was at 29.98 on Friday which is an oversold signal.
Facebook Was Green In The Face Of FTC Investigation
To signal how strong the rally in stocks was on Monday, Facebook stock was up 0.42% even after it was announced that the FTC was going to be investigating Facebook’s data practices. It can be a signal of a bottom when a stock goes up on bad news. From the bottom at 11:20AM, Facebook stock was up 7.28%. The market needs to see a negative FTC ruling or sustained deterioration in usage before Facebook stock crashes. Some people deleted their Facebook account temporarily as a representation that they are unhappy with Facebook’s practices. Ultimately, people will probably come back to the website because it is an important tool to speak with relatives and friends. The bigger issues in usage trends is the decline of original posting. To be clear, I’m not saying Facebook is a long term buy. This is a short term bottom. The long term performance will be affected by regulatory issues and engagement patterns. People won’t stop posting content on the internet. Facebook needs to maintain its market share of these posts.
Risk On Trade Flourishes
The Nasdaq was up 3.26% as the tech stocks were led by 2 of the FAAMG stocks. Microsoft was up 7.6% and Netflix was up 6.4%. Tech usually does well when the risk on trade is in place. The sector was up 4.03%. The worst sectors were the risk off ones: utilities, telecom, real estate, and consumer staples. They were all still up though as the worst one, telecom, was up 0.92% on the day. The VIX was down 15.36% to 21.05.
Minor Bond Selloff
Bonds had interesting action. You’d think with a strong risk on trade, the TLT, which measures the long bond, would be down sharply. However, it was up in the morning before declining in the afternoon, closing down 0.38%. The 10 year bond yield fell near the low end of the recent range as it declined to 2.82% in the morning before increasing in the afternoon, leading it to close at 2.85%. The latest difference between the 10 year bond yield and the 2 year yield is 58 basis points as the curve steepened on Monday. As I reminder, I am more concerned with the yield curve than the 10 year hitting 3%. I think the 3% mark is irrelevant. ‘All hell’ won’t break loose if it passes that level in the next few months.
Dollar And Commodities
The dollar index declined 0.38 to 89.02 which means it got back to its intermediate term negative correlation with the stock market. This is a big move because unlike the bond and stock market, the dollar continued towards the end of its range. The lowest close is only 47 cents lower than the current price. The dollar might be ready to continue its downtrend. It seems reasonable to expect it to get back to the level last seen in 2014 which is about $80 because Trump wants a weak dollar and the economy should be decently strong. A strong economy means the risk on trade will continue; part of the risk on trade is to sell the dollar. Even if the 2.7% GDP growth estimate by the Fed isn’t met, the economy will still be fine. The ECB is also in the process of ending its QE program which is bearish for the dollar versus the euro.
Oil had a rare day where it wasn’t correlated with stocks. WTI fell 33 cents to $65.55. There was profit taking after the rally last week. Last week oil was strong because it looks like the OPEC cuts will continue until 2019. As I mentioned in a previous article, the job total in the energy industry is relatively small, so increasing oil prices are a negative for the economy. At some point near $80 per barrel, rising oil prices will be a negative catalyst for the stock market as consumer sentiment could shift. The commodities ETF was down 0.25%. It’s at $195.78 which is way off the peak in 2014 which was $313.
Investors Become Bearish After the March Correction
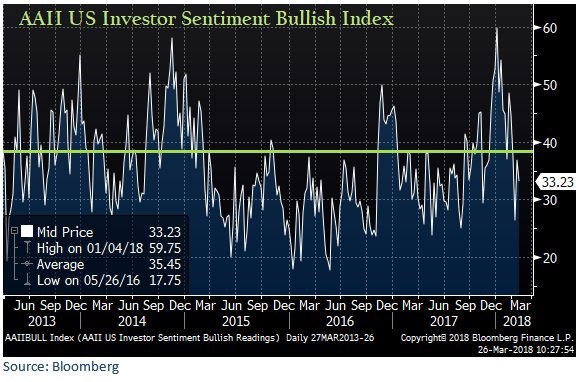
As you can see from the chart below, the AAII U.S. investor sentiment reading in March fell below the 5 year average. The latest reading as of March 26th was 33.23. The recent correction caused sentiment to fall below the low it reached in the previous correction. The more negativity, the better for stock performance in the medium term. As you can see, stocks peaked in January when the index was high; stocks have done well since the Presidential election. Right before the election, investors were nervous. That proved to be incorrect. To be clear, the best usage of this index is to focus on when it hits extremes; you also should pair it with fundamental analysis. The bearishness in this volatile period won’t get to cyclical extreme levels because the economy is fine and earnings are fantastic.
Conclusion
My forecast for the stock market to stay within the recent range was correct as the S&P 500 bounced off the recent lows. I don’t see enough negative economic stats or any problems with earnings to justify a bear market. I also still don’t see a reason for the S&P 500 to make a new all-time high in the next few weeks. The market is now down just 0.56% year to date with 4 trading days left in the quarter to make this another winning one.