Stocks Rally and Ramp On Monday
Stocks Rally - Monday was an amazing day for equities as the S&P 500 increased 0.77% and the Nasdaq increased 0.91%. The Russell 2000 was only up 0.16% because the catalyst for the ‘risk on’ trade was the trade deal between America and Mexico.
Large caps are helped by trade more than small caps. The timing of the deal puts more evidence behind my thesis that Trump wants to get them done before the mid-term elections to make his party look better to the voters.
The CNN Fear and Greed index has increased to 77 which is extreme greed. I am now bearish in the short term because stocks are overbought. A few months ago, it was popular to say the bull market was stalling and now it’s popular to say new all-time highs are certain.
This sentiment change explains why I’m bearish.
The trade deal with Mexico is a positive, but stocks still can’t go up every day.
The stocks most affected by trade did the best. GM stock was up 4.84%; Boeing stock was up 1.24%; and Caterpillar stock was up 2.78%. The Mexican peso was up 0.7% versus the dollar.
The best sectors were the financials and materials which were up 1.34% and 1.47% respectively. The worst sector was the utilities which declined 0.64% because the action was ‘risk on.’
Stocks Rally - Trade Deal With Mexico
The trade deals need to be passed by Congress. This preliminary deal with Mexico will be voted on after the mid-term elections. It will be interesting to see what will happen to all these deals if the GOP loses control of Congress.
This makes the elections more important than they’d otherwise be. Markets often root for gridlock because it means nothing bad will get done which means there is certainty.
In this case, gridlock would be a problem. If none of the trade deals are allowed to pass, there will be a trade impasse.
The biggest negative of this deal is the lack of certainty on what it means. We don’t know if Canada will be included in the deal as Canada isn’t included in the preliminary agreement.
President Trump’s goal is to increase manufacturing jobs in America and lower the trade deficit. I think future deals will look a lot like past deals. We’re far from certain if that future will be realized.
Stocks Rally - This news was an incremental improvement on the trade situation and the market reacted appropriately.
If there was 100% clarity on the deal, stocks would have increased more.
However, it’s still good because we’re going in the right direction. The White House has said the deals will fall like dominos after the first one is made. If countries are making deals with America, it makes the ones who haven’t look bad.
The next logical domino to fall is Canada. Don’t underestimate the importance of Canada. It is America’s 2nd largest trading partner. China is the most important.
Stocks Rally - Treasuries Update
The 10 year yield was up 2 basis points to 2.83% and the 2 year yield was up 1 basis point to 2.63%. The curve has flattened substantially as the latest difference between the two yields is only 19 basis points (because of after hours action).
The chance of at least 2 more hikes this year is now up to 69.4%. It’s very disconcerting that the yield curve is this flat with the Fed’s 4th rate hike this year not even fully priced in.
We can easily see the 2 year yield increase to 2.7% with the rate hike fully priced in. That would push the difference to only 14 basis points.
At this stage, even one rate hike next year isn’t likely. The Fed would be pushing the limit by hiking after an inversion. That being said, if growth remains strong, it’s possible that the unlikely occurs.
It’s unusual for economic growth to be strong while the 10 year yield is moribund. The chart below gives us insight into where the 10 year yield could be headed for the rest of the year based on seasonality.
As you can see, the treasury yield has followed seasonality quite well this year. If it continues, the 10 year yield will fall a few more basis points, virtually insuring an inversion.

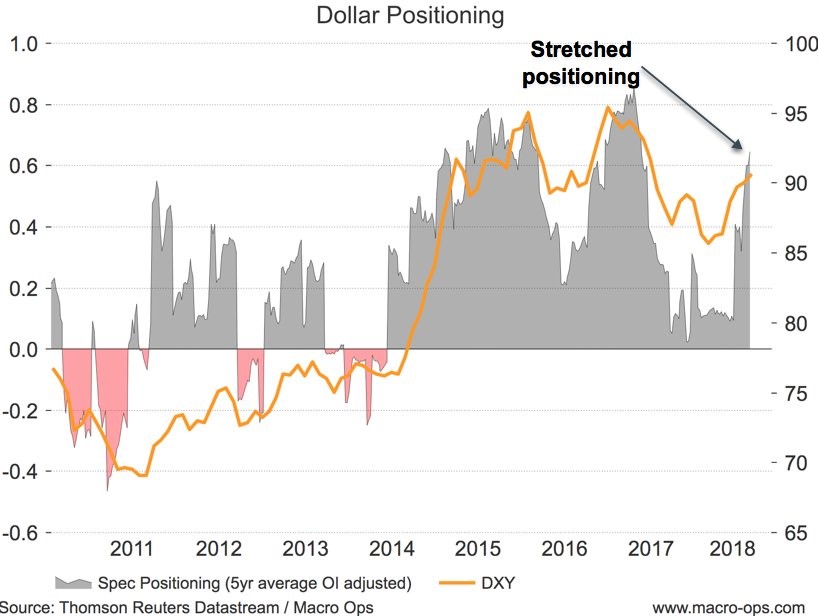
Stocks Rally - Dollar Index Has Fallen
From August 14th to August 28th, the dollar index fell from $96.73 to $94.68. This is the same time the Shanghai Composite has done well. The chart below shows the open interest adjusted 5 year average speculative position in the dollar compared to the dollar index.
As you can see, it is currently stretched which means in the intermediate term it should fall. If it falls, the S&P 500 has a great shot at ending the year with double digit returns. It’s already up 8.35% year to date.
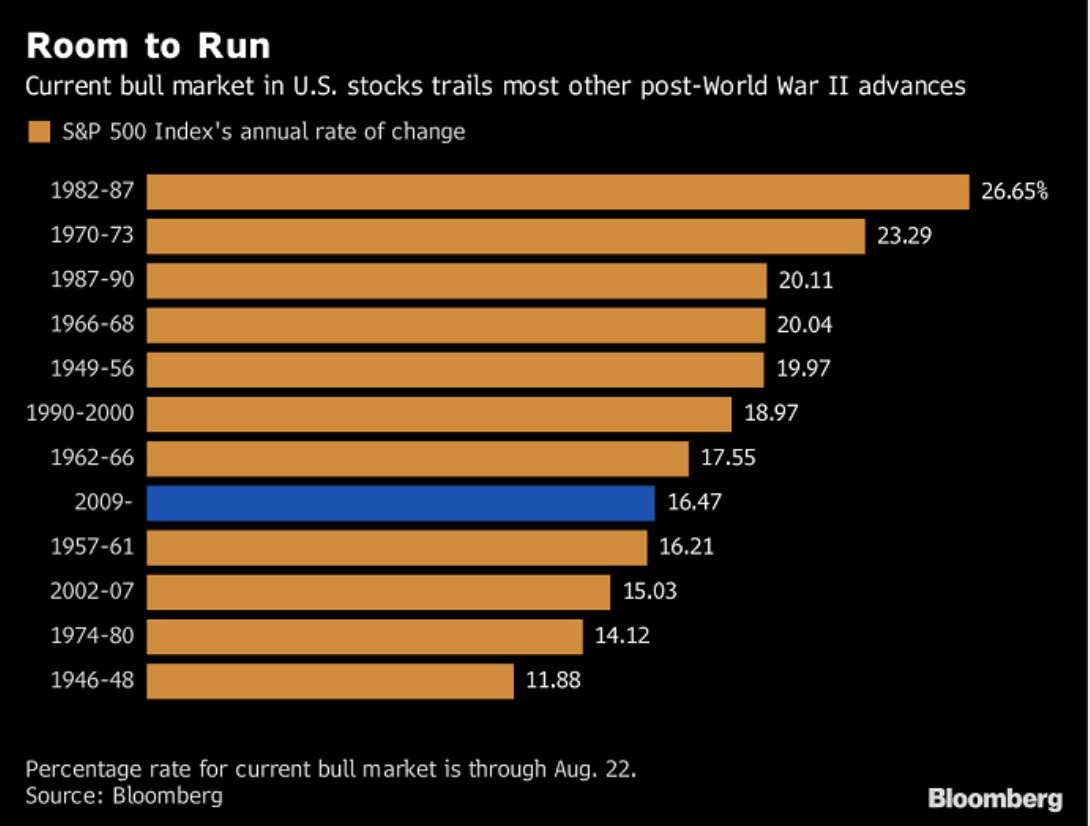
Stocks Rally - Longest Bull But Not The Best Per Year
The bears are worried that this bull market is the longest ever, while the bulls promote the chart below which shows this bull market has had relatively weak annualized gains.
This is a bad argument to get involved with because it doesn’t matter that this is the longest bull ever and it doesn’t matter that the gains have been low per year.
The fact that the 1980s bull market did well doesn’t mean you should be bullish now because the fundamentals differ. It’s fair to compare the fundamentals to previous periods and then look at what the returns could be. Just looking at them on an annualized basis doesn’t help.
Stocks Rally - Conclusion
There was an incremental improvement in the trade deal negotiations between America and Mexico. The S&P 500 is still overbought even if a deal gets done.
The fear of a slowdown is reasonable even though the market is ignoring it. While it’s difficult to say for sure how deep the slowdown will be and how long it will last, it’s easy to see stocks aren’t pricing it in.
Stocks are making the short trade easy to act upon because traders are getting euphoric. The fact that the yield curve is near an inversion still doesn’t matter if you’re looking at the short term. Flattening means the odds of a recession in 2020 are increasing.