Stocks Finally Decline
There was some volatility on Wednesday morning, but the market ended up higher which put it on a 3 day winning streak. That was a 7.66% gain since May 13th. Stocks were very overbought. You could tell sentiment was overheated because there were people saying you should be permanently bullish on stocks and that they never go down.
It’s not necessarily a bad idea to be bullish on American stocks for the long run, but you didn’t hear people saying that in late March. People were calling for another Great Depression then. That’s a huge swing in sentiment. This makes many bearish on the short term even though we're bullish in the intermediate term.
For some to be bearish on the short term even though we're bullish on the economy takes a lot of euphoria in markets. That’s what we have seen as there was a point on Thursday in which the S&P 500 was 11.3% higher than its 50 day moving average. In the past 20 years, that has only happened once as it occurred in May 2009.
This market is different from 2009 because in 2009 the market was very cheap. It’s not cheap at all now which means we don’t see the explosive upside that occurred in the 2nd half of 2009 occurring in the 2nd half of 2020.
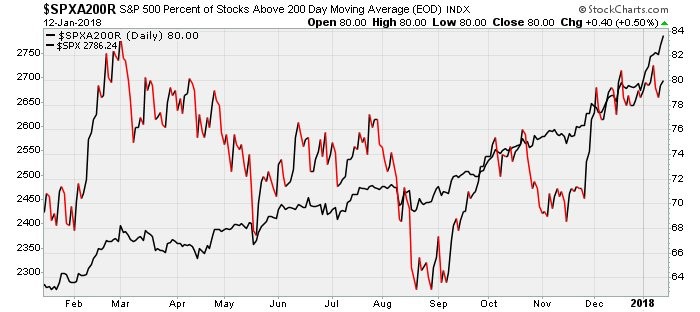
As you can see from the chart above, 94% of S&P 500 stocks were above their 50 day moving average. Only 43% are above their 200 day moving average which makes this similar to Q1 2019 when the stock market rebounded from a big correction. If the market reaches a new high this summer, you can say this is closer to the late 2018 and October 1987 crashes than other bear markets. It’s notable that when the market was very overbought in the short term in 2019, but not overbought in the long term, it didn’t lead to a correction.
It took until May for the market to correct 6.5%. In May the 200 day moving average had signaled the market was modestly overbought. The stock market fell last May because of the trade war with China. This is exactly the same setup as today since the end of COVID-19 is allowing the U.S. to focus its attention on its grievances with China over Hong Kong sovereignty and China’s handling of COVID-19.
Sentiment Review
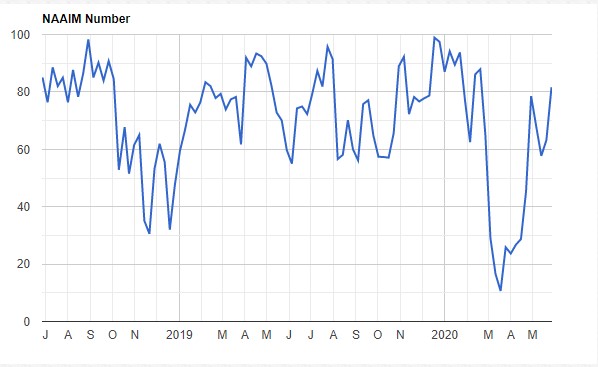
Optimism has been increasing. I’d argue the market is overheated. Each indicator tells a slightly different tail. CNN fear and greed index was at 53 on Wednesday and fell to 50 on Thursday. Both are neutral. As you can see from the chart below, the NAAIM index increased from 63.22 to 81.65 this week which is the highest level since February. Finally, fund managers have gone all in on this market because of FOMO.
Investors used this indicator in March as a buy signal because fund managers lowered their exposure to risk assets. Even though the May fund manager survey from Bank of America showed managers had a lot of cash, that has changed in the past 2 weeks. To be clear, when this index hit 78.55 on April 29th, it was a decent sell signal as the market fell 4% and didn’t hit a new high until May 18th.
Now the index is even higher which makes it a stronger signal. Personally, I’d rather this indicator to be higher before I’d sell stocks based on it alone. However, my non-scientific measurement of sentiment tells me markets are due for a pullback. Plus, according to Bespoke invest, as of Wednesday, not a single stock in the S&P 500 was oversold and 70.2% were overbought.
AAII individual investor sentiment index finally isn’t telling investors to buy stocks. It’s neutral as the percentage of bulls rose 4.1% to 33.1% and the percentage of bears fell 2.9% to 42.1%. There are 4.9% fewer bulls than average and 11.6% more bears than average. It’s not exactly a sell signal that there are more bears than bulls, but it’s not going against my opinion to be bearish in the short term. And it’s quite odd to see more bears than bulls after such an amazing run.
Investors think the market is expensive which means we could see the percentage of bulls actually increase if the market falls 5%. That would make the AAII survey give a bearish contrarian signal. But some would be bullish because markets wouldn’t be overbought in the near term. Some are just not using the AAII survey at the moment.
Thursday’s Action Reviewed
The market sold off on Thursday right after it passed its 200 day moving average which is exactly what I expected. Some technical analysts probably thought passing the 200 day moving average was bullish. But data that showed after big selloffs when the market recovers past its 200 day moving average, it’s a signal the market is ready to correct. S&P 500’s 0.21% correction seemed worse than that decline indicates because there was a major reversal and because small caps sold off hard. Russell 2000 fell 2.48%. The S&P 500 was 1.25% off its afternoon high.
It fell 1.25% from 3:15 PM to 3:55 PM. Stocks fell after President Trump indicated he would give a press conference on China on Friday. As predicted, the President is about to go after China now that the emergency of COVID-19 has waned. This is a long term negative. Biden and Trump are trying to compete for the title on who is the toughest on China. No matter who wins, America and Chinese relations are about to go downhill.
Energy was the worst sector as it fell 2.91%. 2nd worst was the financials which fell 1.56%. Best sector was the utilities which rose 3.04%. Twitter and Facebook fell 4.45% and 1.61% after Trump went after them for what he called political bias.
Shopify and some of the other previously hot tech stocks have been cratering. Shopify is down 9.8% from its peak on Friday. Twilio is down 8.3%. Those were overheated names.