Trade Tensions Get More Serious
Stocks plummeted and then rebounded somewhat at the end of the trading session on Monday because of the latest trade tensions. The S&P 500 ended the day down 1.37% and the Nasdaq fell 2.09%. The Dow fell 1.33% which pushed it below its 200 day moving average for the first time since June 2016. I don’t think this is important because the market is being driven by trade headlines, not the technicals. Even the Russell 2000, which has avoided the weakness from trade tensions in the past few weeks, declined 1.67%.
The trade situation started with the Wall Street Journal report on Sunday which stated the Trump administration will stop Chinese firms from making investments in American technology and block American firms from exporting more technology to China. Specifically, the proposal would prevent companies which have at least 25% Chinese ownership from buying firms with “industrial significant technology.” That’s a vague term which can easily be utilized to prevent many transactions. Eliminating Chinese acquisitions takes a buyer out of American markets which should push stocks lower.
On Monday, Steve Mnuchin tweeted that these actions will be affecting “all countries trying to steal our technology.” Usually when government officials try to clarify situations which are generating controversy, they try to quell worries. However, this made worries much worse because he added potential tariff targets. Instead of clarifying the issue, it became opaquer because we don’t know the other countries which are supposedly stealing American technology.
As I mentioned, there was a bounce late in the trading session on Monday. That occurred because President Trump’s trade adviser Peter Navarro came on CNBC where he stated "There's no plans to impose investment restrictions on any countries that are interfering in any way with our country. This is not the plan." It appears the President wants to quell the market while continuing to negotiate to get the best deal. In my opinion, the bulls should want a quick stock market correction on trade tensions because then the President will fold his cards, meaning no more tariffs will be issued. Without these trade tensions, the S&P 500 would be about 100 points higher.
Q2 Earnings Update
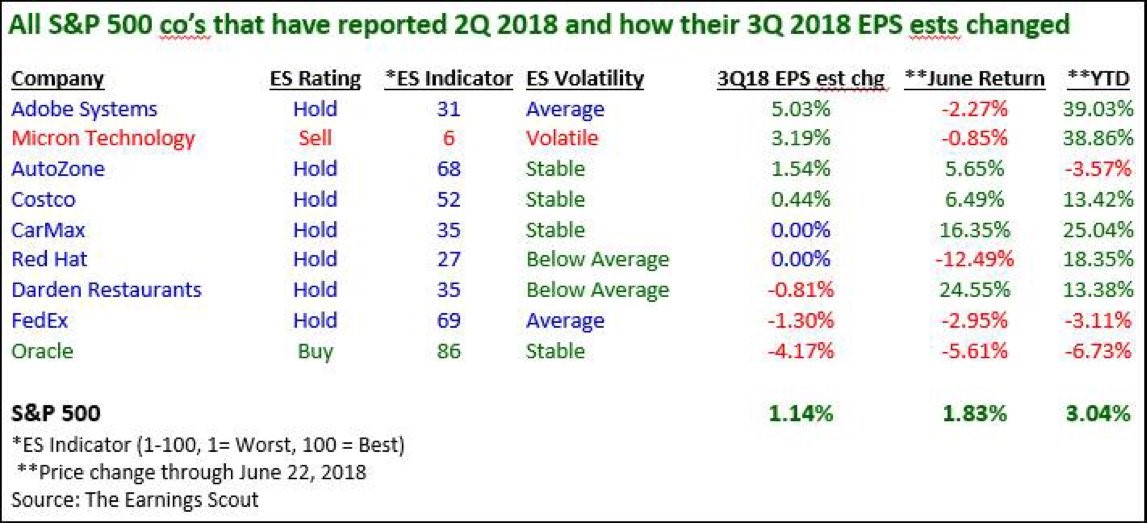
In a market where headlines are driving returns, it’s nice to discuss actual earnings results and changes to analysts’ estimates to stay grounded. The trade tensions are causing slight weakness in global trade growth, but the answer shouldn’t be to sell everything given the possibility that this is a short term issue. As of the end of last week, 9 firms have reported earnings. The table below does a great job of breaking down the specifics of each firm. It’s easy to do this now that there are so few firms which have reported. It’s great when you are doing holistic analysis to point out specific companies to get a complete picture of the situation. It combines the best of micro and macro analysis.
As you can see, even though all firms beat their EPS estimates, this wasn’t exclusively a group of high flying firms. Their collective year to date returns are 3.04% which is near where the S&P was at on Friday. Micron had a big decline on Monday as the stock fell 6.9% along with overall weakness in tech. It had a 3.19% increase in its Q3 earnings estimates, but that might be priced in because it was up 38.86% as of Friday’s close. It’s great to see that the average estimate change for Q3 earnings in this group was up 1.14%. 4 firms’ estimates were up, 2 were flat, and 3 were down.
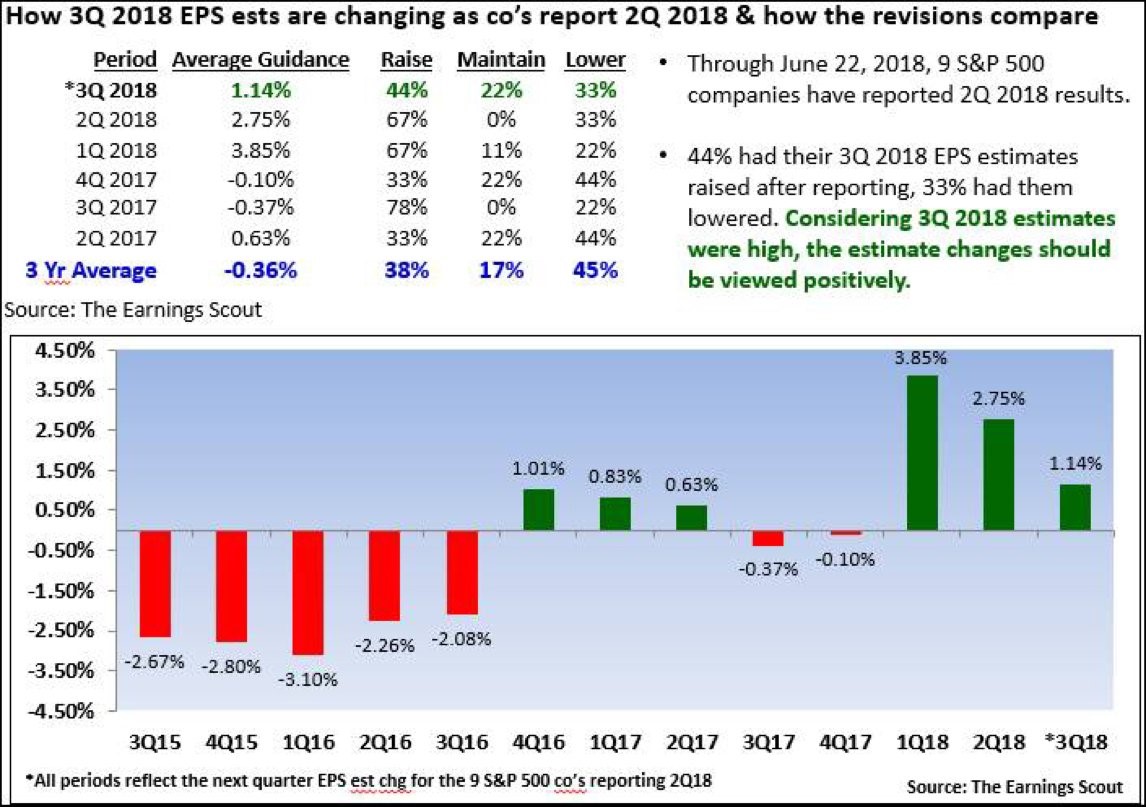
The chart below gives more specifics on the changes made to earnings estimates. It’s interesting to see the shift in estimates after the tax cuts. Even though 2017 was a rebound year for earnings after the down year that was 2016, it had negative changes to estimates in the second half. The overall estimates for Q3 2017 were clearly affected by a few firms because 78% of firms had their estimates increase and only 22% saw them decline.
This information is all about getting an edge in rate of change terms. Revisions looked great for Q4 2016. If you bought stocks then, you would have done well. It appears the estimate changes were about to get much worse for 2018 results if wasn’t for the tax cuts. They really came in handy at a time when comparisons were about to get tougher.
To be clear, as it says in the chart, you need to consider the net results before becoming bearish because the rate of revision improvement has come down. The revisions for Q1 2018 were very rare as the tax cuts were just being implemented. The estimates for Q3 being revised upward is positive because the initial expectations were very high. Even with all 9 firms beating results, only 44% had their Q3 numbers raised. Since not all firms will beat their estimates for the rest of the earnings season, I expect this revisions rate to get worse.
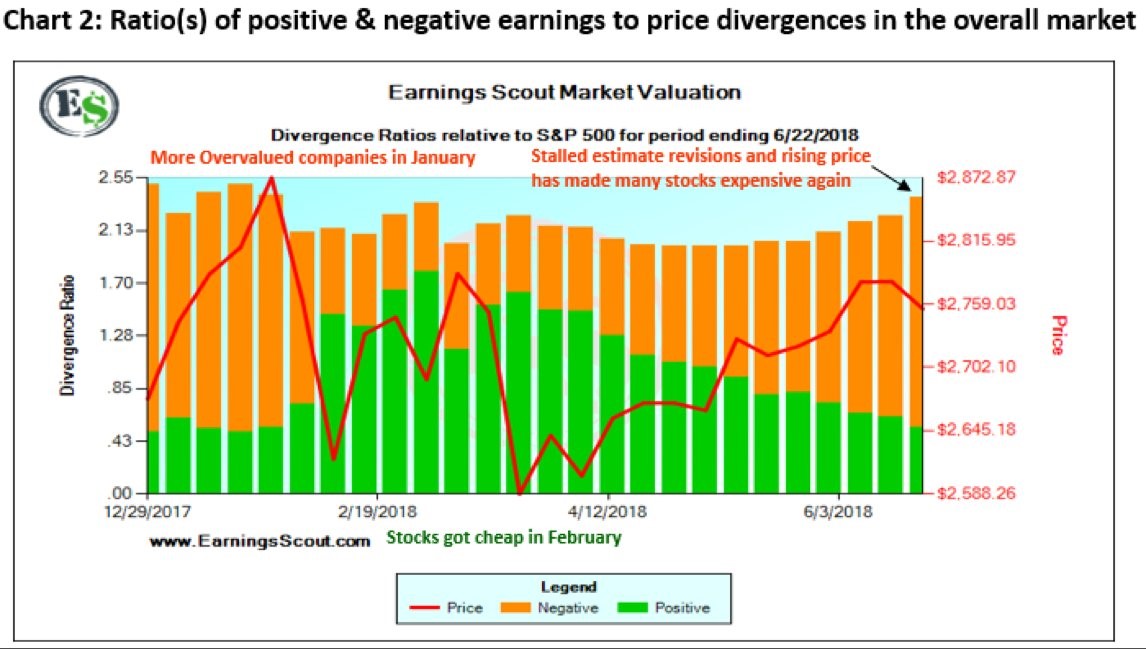
The chart below reflects the rate of change results for earnings revisions. As you can see, this indicator told you to sell in January. It also told you to buy in February and March. Then it told you to sell in June. Keep in mind, that the latest S&P 500 performance isn’t reflected in this chart.
The decline in the S&P 500 in the past few days implies you shouldn’t necessarily sell stocks in late June. Like I mentioned earlier, the estimates for Q3 2018 are very high. It’s not surprising to see that revisions aren’t matching the positivity which occurred after the tax cuts started going into effect early this year. Looking at the situation longer term, the 2019 earnings estimates will tell us if the rate of change decline in earnings growth after Q3 2018 will be strong enough to cause a bear market or if the gains will simply be lower.