Valuations & Earnings
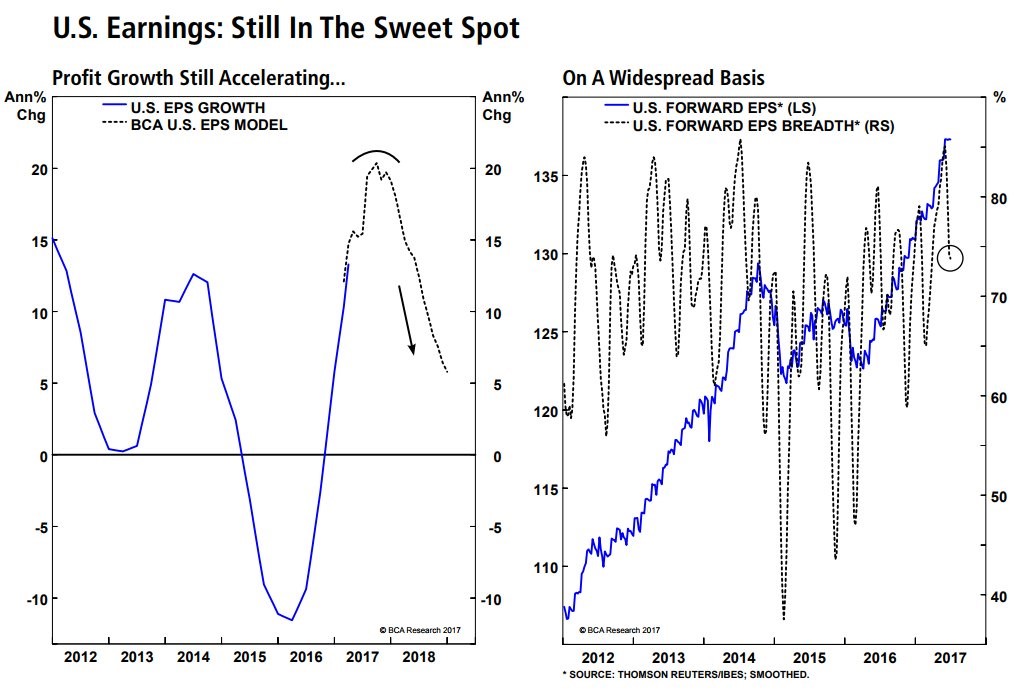
The chart below on the left is the exact depiction of the earnings cycle which I have been discussing. The key theme is easy year over year comparisons and the improvement coming from the energy sector. That will end in 2018 which is why I am bearish on stocks in 2018 (unless tax cuts are passed), but bullish for the next few months. Technology has been more secular than cyclical, but, as you can see from the weakness in 2013 and 2015-2016, it hasn’t prevented setbacks. It’s interesting to see how 2013 was a bad year for earnings growth yet the S&P 500 had a total return of 32.39%. That strength might be because of the optimism seen in the chart on the right.
The forward earnings estimates increased along with stocks in 2013 and fell with them in 2015 and 2016. Forward earnings estimates are the best way to tell where stocks will go as long as there isn’t an estimate miss. The chart on the right also shows the EPS breadth which sometimes is able to show where the EPS estimates are going. In the past few weeks, breadth has weakened, but it’s still relatively strong, so I wouldn’t get bearish yet. Whether the market declines depends on how weak year over year EPS growth gets in 2018 and if it causes forward estimates to fall.
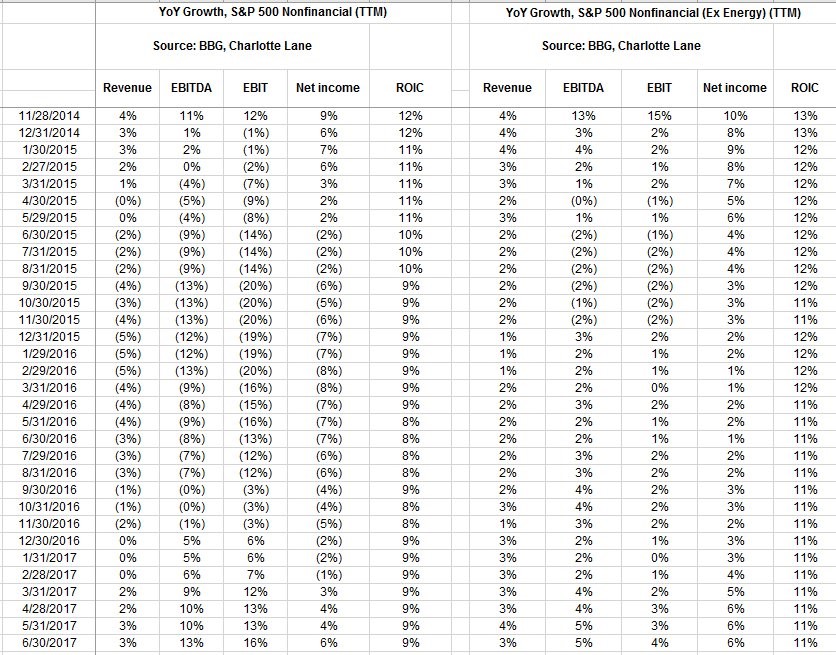
The spreadsheet below shows a clear picture of how earnings were manipulated by the energy sector. As you can see, the worst EBIT growth number ex-energy and ex-financials was -2% which is much better than the -20% result when you include energy. Net income never declined without energy and financials. If you were a bullish investor who ignored energy on the way down, then you can’t claim victory now because of the sector’s rebound. The 2018 earnings growth will decelerate because of energy. Will the bulls ignore the sector again?
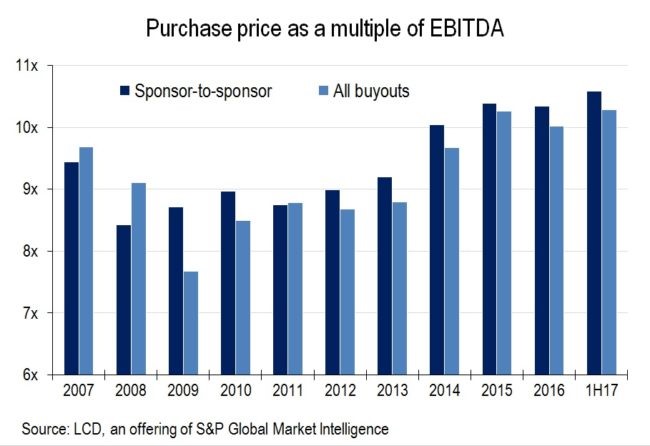
The chart below gives us an interesting picture into how expensive stocks have gotten. As you can see, the purchase price of buyouts has been more expensive than 2007 from 2014 until now. The current debt/EBITDA ratio is slightly below the 2007 level. Private equity has $906 billion in cash of which $560 billion is in buyout funds meaning there is a lot of capital available to pay these expensive multiples.
Economic Reports
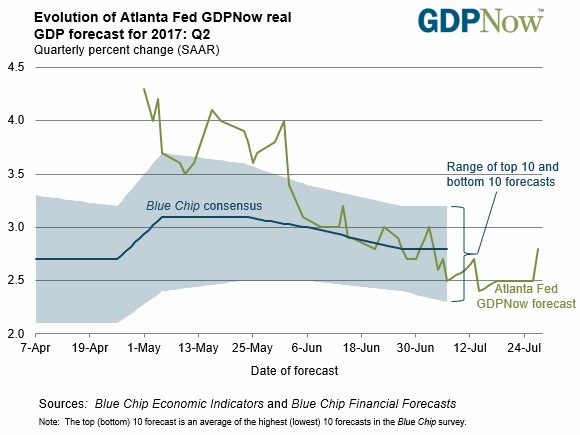
Thursday was a big day for economic reports. Let’s start with looking at the GDPNow update, which is its last one before the Q2 preliminary GDP report on Friday. The final estimate was increased by 3 tenths of 1 percent to 2.8% making it exactly in line with the blue-chip average. The improvement came because of the durable manufacturing report and the retail and wholesale inventories report. This last shift puts it much higher than the 2.04% estimate the NY Fed’s Nowcast has. Anything above 2% should make investors smile as they don’t see any economic catalyst which can derail the great earnings results seen in Q1 and Q2.
Even though the durable goods orders for June helped boost GDP estimates, with some going above the 3 handle, it wasn’t that great of a report when you delve into the details. The headline number was that durable goods orders improved 6.5% which was much higher than the 5.3% growth expected by economists. However, excluding autos and aircrafts, growth was only 0.2%. Airline bookings were up 131%; Boeing has been doing well with its stock up over 30% in the past 3 months. Autos and parts orders fell 0.6% after increasing 1.2% in May. Clearly the weakness in autos wasn’t able to stop June from being a great economic month. It looks like the auto bubble bursting won’t push the economy into a recession in the next few months. The worst part of the report was a 0.1% decline in non-defense, non-aircraft capital goods orders after a 0.7% increase in May. This was the worst growth rate since December.
While the auto weakness wasn’t able to stop the durable goods headline from being great, it appears to have hurt the jobless claims last week. Unusual for this year’s economic reports, the jobless claims missed expectations as it rose 10,000 from a 3-month low to 244,000. The weakness has been caused by automakers shutting down manufacturing plants for retooling. GM extended its shutdown because of weakness in sales heightened inventories. When I say that the auto industry affected this number, I mean it is responsible for the miss. This is not a bad report as I would need to see claims above 270,000 for a few weeks before I get worried. With corporate profits healthy and small businesses optimistic, I see no reason for a sharp rise in jobless claims to occur in the next couple of months.
Along with other consumer confidence surveys, the Bloomberg Consumer Comfort Survey improved this week. The headline reading was up 1 point to 48.6 as consumers are happy with the labor market and rising stock prices. The measurement of the economy index improved 0.9 point to 45. The index for part-time workers hit the highest level since February 2007. That shows that it’s easy to find a job. I had expected the sentiment indicators to fall after Trump’s agenda was slowed. However, it appears the weakness because of Washington was temporary. No matter what you think of Washington, if you have a job and own stocks, you are happy. Part-time workers are satisfied even with the weakness in retail and restaurants. If restaurants were to have a strong 2nd half of 2017, I think wage inflation would increase to levels seen in previous cycles.
Conclusion
Forward earnings estimates drive stock prices. Investors who were concerned about how the 1.2% annualized GDP growth would impact corporate profits can now rest assured as annualized GDP growth in Q2 returns to a 2 handle. If GDP growth surprises to the upside and reaches 3%, I think stocks can rally for the rest of the summer.