Small Cap Value Is Destroyed
On Thursday, the stock market broke. There was nothing wrong with trading, but the relative performance of the small cap value stocks versus the major tech stocks hit extreme levels. It’s unnerving. There is little doubt this is a tech bubble. A problem with bubbles is they lead to unrelenting selling pressure which means a tech stock that’s currently 20% overvalued can fall 40%. Stocks go from too expensive to too cheap. They overcorrect.
Nasdaq is outperforming the S&P 500 by 3.3% this week which is remarkable because the S&P 500 is up this week. Nasdaq keeps outperforming the S&P 500 even though the large cap index is doing fine itself. Furthermore, the only reason the S&P 500 is doing well is the top FAAMNG names.
Also, Nasdaq’s outperformance this week is its 2nd biggest outperformance since October 2008 if the week ended Thursday. Another example was this April. Nasdaq 100 has outperformed the S&P 500 by at least 0.98% for 5 weeks in a row. That’s the longest streak since November 1999 which was a few months before the tech bubble burst.

Small cap value has been doing terribly. Regional banks are in disaster mode. S&P 600 value index was down 2.99% on Thursday as it is down 17.8% since June 8th. It’s only up 29% since the March bottom. KBW regional bank ETF was down 4.12% as the index is down 26% since June 8th and is only up 21.5% since the March bottom. To be clear, it makes sense the banks and small caps have done poorly.
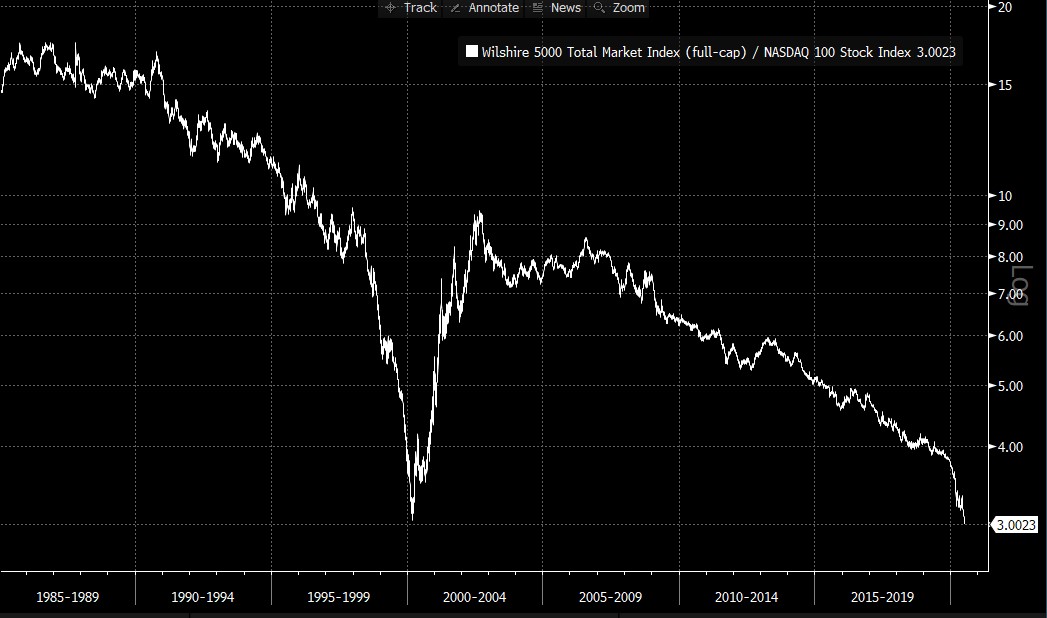
Banks are getting crushed by non-performing loans and weak net interest margins. Interest rates are low and the yield curve isn’t that steep. The chart above shows how this has played out. Wilshire 5,000 divided by the Nasdaq 100 is at the same level it was at in March 2000 when the tech bubble peaked. This bubble has only lasted 3.5 months. The 1990s tech bubble was 2 years.
Amazon Is A Bubble?
Nasdaq was up 0.53% to another new record high, while the S&P 500 fell 0.56% and the Russell 2000 fell 2%. The CLOU cloud ETF was up 0.79% as it is up 19% since June 11th and 82% since March 16th. AMD led the market higher as it was up 7.2% which means it’s now up 14.3% since June 26th. I
t’s one of the few tech stocks not at a record high. Tesla was up 2.1% to another new record high. Amazon was up 3.3% to a new record. Earnings season is starting next week with the big internet names reporting at the end of July and the beginning of August. That could pop the bubble.
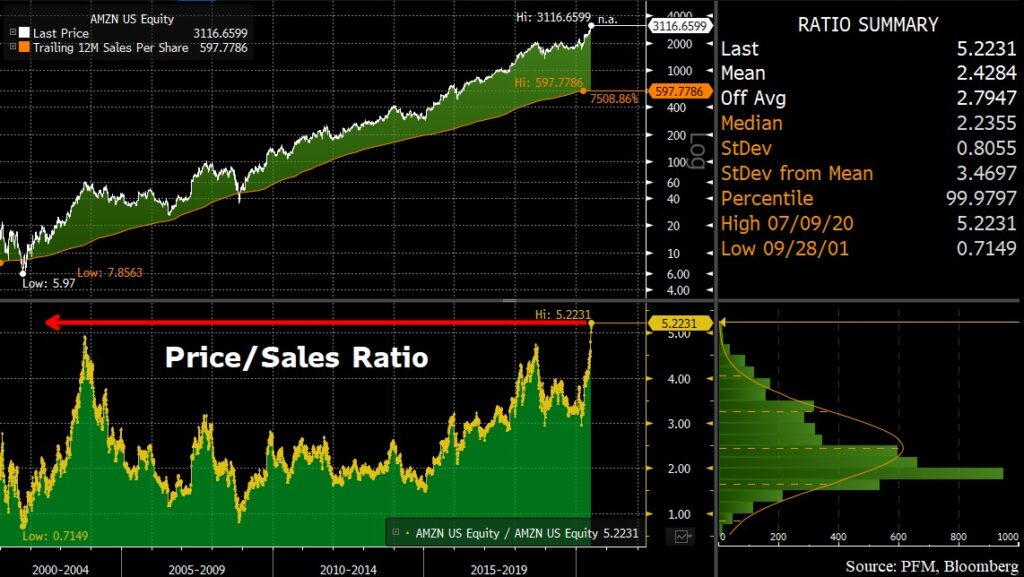
As you can see from the chart above, Amazon has the highest price to sales ratio in its history which is amazing because it’s a mature company. 10 years ago, when it had many years of growth ahead of it, the stock had a price to sales ratio of less than half of what it is now. Some say this isn’t a fair comparison because Amazon recently developed AWS, but I disagree. AWS has been growing quickly and profitably for a few years now. Amazon’s price to sales ratio is 3.5 standard deviations above the mean.
If the stock were to go back to its average price to sales multiple, it would need to fall 53%. If it got oversold and fell 1 standard deviation below the mean, it would fall 69%. And, if Amazon fell 69%, the momentum tech stocks like Shopify would fall at least 80%. Nasdaq would fall at least 40%. Personally, I see the Nasdaq falling 20%, with Apple and Amazon falling at least 20% as well.
Because of Amazon, the consumer discretionary sector was the best performer as it was up 0.77%. Energy was down 4.85% and the financials fell 2.15%. Only at the peak of the tech bubble in the 1990s and the bottom of the financial crisis has the Nasdaq 100 outperformed the BKX bank index by more in the past 6 months.
Many of the banks are cheap. Wells Fargo is only up 6.7% from its bottom on May 13th. It’s actually down 4.8% from its March 23rd low. Wells Fargo trades at 0.61 times its book value which is only slightly above where it traded at during the financial crisis even though it is in a much better situation now.
Chinese Bubble Might Be Popping
Shanghai Composite finally didn’t rise on Friday as it was down 1.95%. This ended its 8 day winning streak. National pension plan cut its holding in PICC stock which fell 7.66% on the news. It seems like the Chinese government is trying to prevent a bubble. It's doubtful there will be a bubble like 2015 because we are too late in the game. Once the Nasdaq bubble bursts this summer, there won’t be bubbles in global markets.
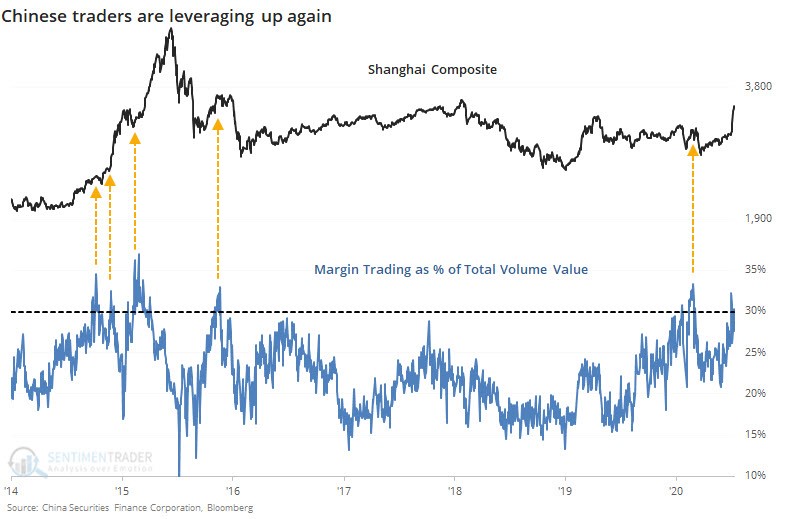
As you can see from the chart below, margin trading in Chinese stocks now is about 30% of the turnover value of the Shanghai Composite. That threshold has been surpassed 4 other times since 2014. Interestingly, in the 2015 bubble, most of the rally came after the margin trading in Chinese stocks went away. This isn’t a great timing mechanism.
Conclusion
Large tech stocks have destroyed small cap value stocks. I’m very bullish on the banks because they are cheap. Some are bearish on the tech sector because it is expensive. Even the king of the FAAMNG stocks, Amazon, now has an extreme valuation. Prior to this recent rally, I had never called Amazon a bubble.
Prior rallies in the FAAMNG stocks from 2009 to 2019 were mostly based on earnings. This is a bubble that’s based on shear speculation by both professional investors and retail traders. FAAMNG stocks are popular among retail traders. Even worse, these traders think these expensive stocks are safe. It’s never safe to buy an expensive security.