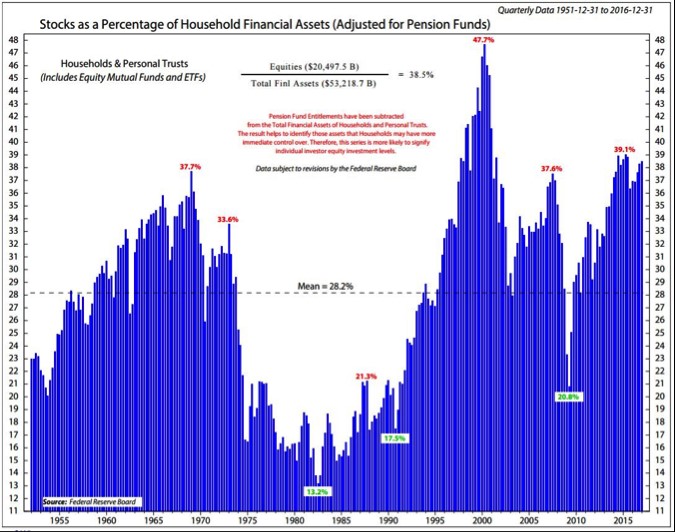
The stock market on Monday had another sluggish day as the trading range was tight. In the past 27 years the S&P 500 has had 15 days with ranges of less than 0.25% and four of them have been in the past month. It’s quite unusual action. I think this trend of low volatility begets more quiet action because it causes investors to buy every micro dip. There is money flowing into the market which doesn’t care about valuation. You can make the argument that low interest rates have broken the market. It certainly put a floor into the market. The chart below contextualizes this move in the stock market. As you can see, stocks as a percentage of household financial assets is the highest in 65 years outside of the tech bubble. This chart is almost identical to the Shiller PE index.
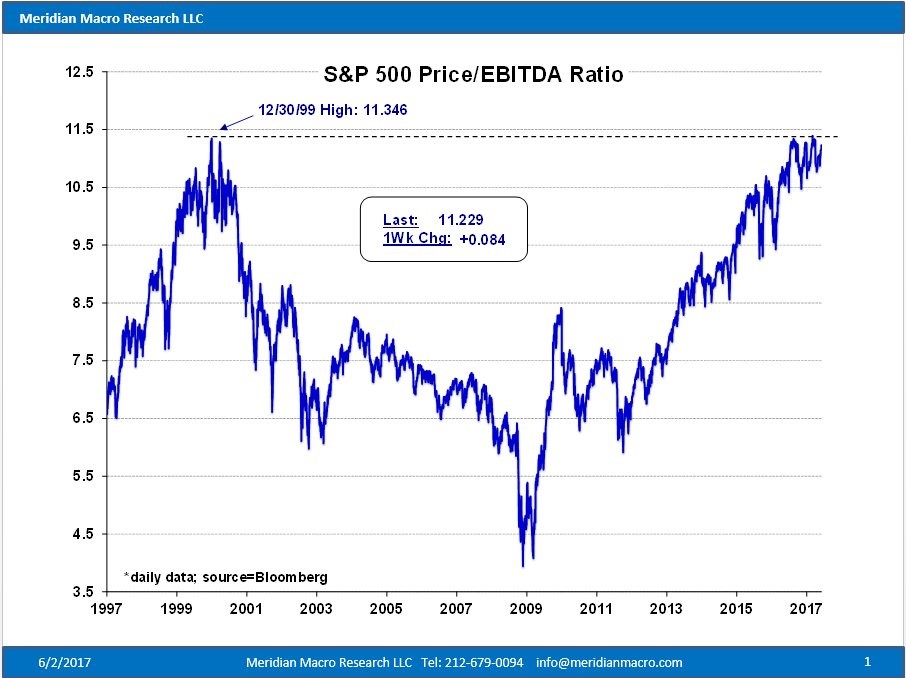
Because of low interest rates pushing everyone into the stock market, valuations have gotten excessive. As you can see from the chart below, the S&P 500’s price to EBITDA ratio is near a record high last seen in 1999. This is a rare valuation metric which has the stock market near late-1990s levels. To be clear, most valuation metrics have the market below the late-1990s levels as the tech bubble saw excessive valuations which I don’t see ever being matched.
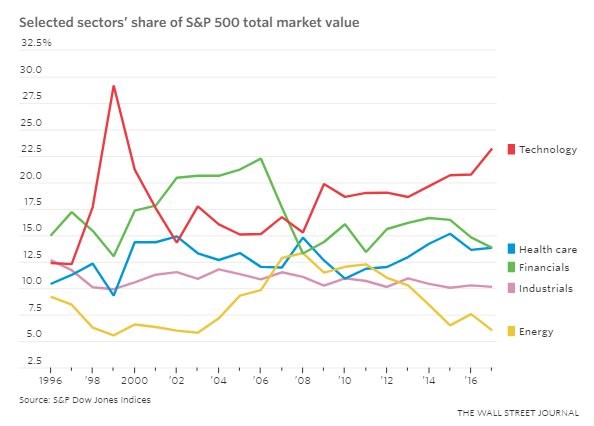
To further our comparison of this market to the late 1990s, the chart below shows the weighting of each sector. Technology is still down about 5% from the record high. It’s also worth noting that the price to sales multiples and price to earnings multiples are lower now than in the 1990s. I don’t know if it’s fair to compare valuations to the 1990s because I expect most future bull markets to fall short of reaching those heights.
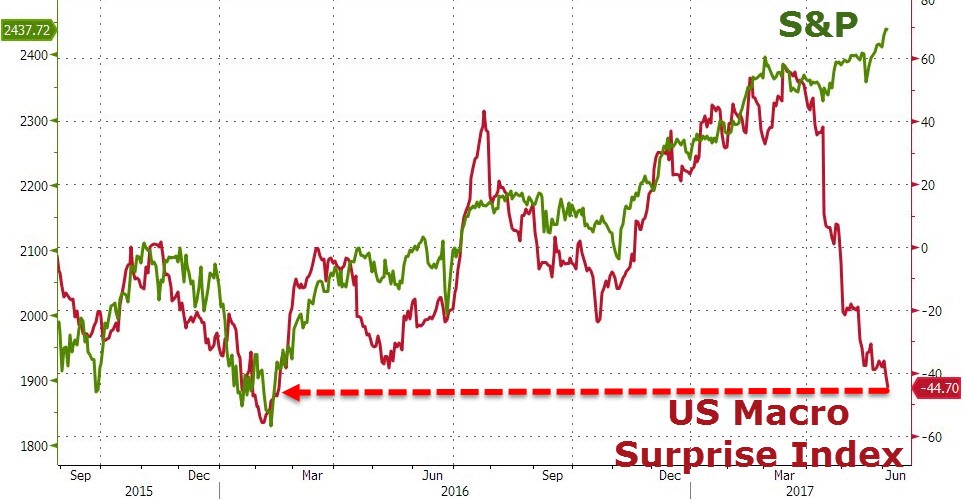
As was mentioned in my last article, the U.S. Citi Macro Surprise Index usually does badly in June and has great performance in the last few years in July and August. On cue, the index is now doing terribly, as you can see in the chart below. It is at a 16-month low, while the S&P 500 hovers near its all-time high. The stock market could use a similar positive run in the macro surprise index that it got last July. The Macro Surprise index is mimicking the yield curve which is flattening. The difference between the 10-year and the 2-year bond is at 87 basis points. By definition, Fed rate hikes should be flattening the yield curve. The macroeconomic conditions aren’t supposed to go south this quickly because of rate hikes. The next few weeks will give us a better picture of Q2 GDP growth. If GDP has a solid quarter and earnings estimates continue to stay high, the stock market will likely continue to ignore this index. The chart below is negatively biased because it only shows the past few months. In the long term, the S&P 500 and the index aren’t as tightly correlated as it seems.
This string of low volatility may come to an end when the Fed makes its decision on rates next Wednesday. There is a 93.5% chance of a rate hike. The Fed will also give more details on the unwind of the balance sheet. I’m not saying this will generate extensive volatility, but it’s certainly something which can move the market more than it has been moving lately. Anecdotally, the past few months have felt like nothing I’ve witnessed since I started following the market in 2007. It’s very quiet.
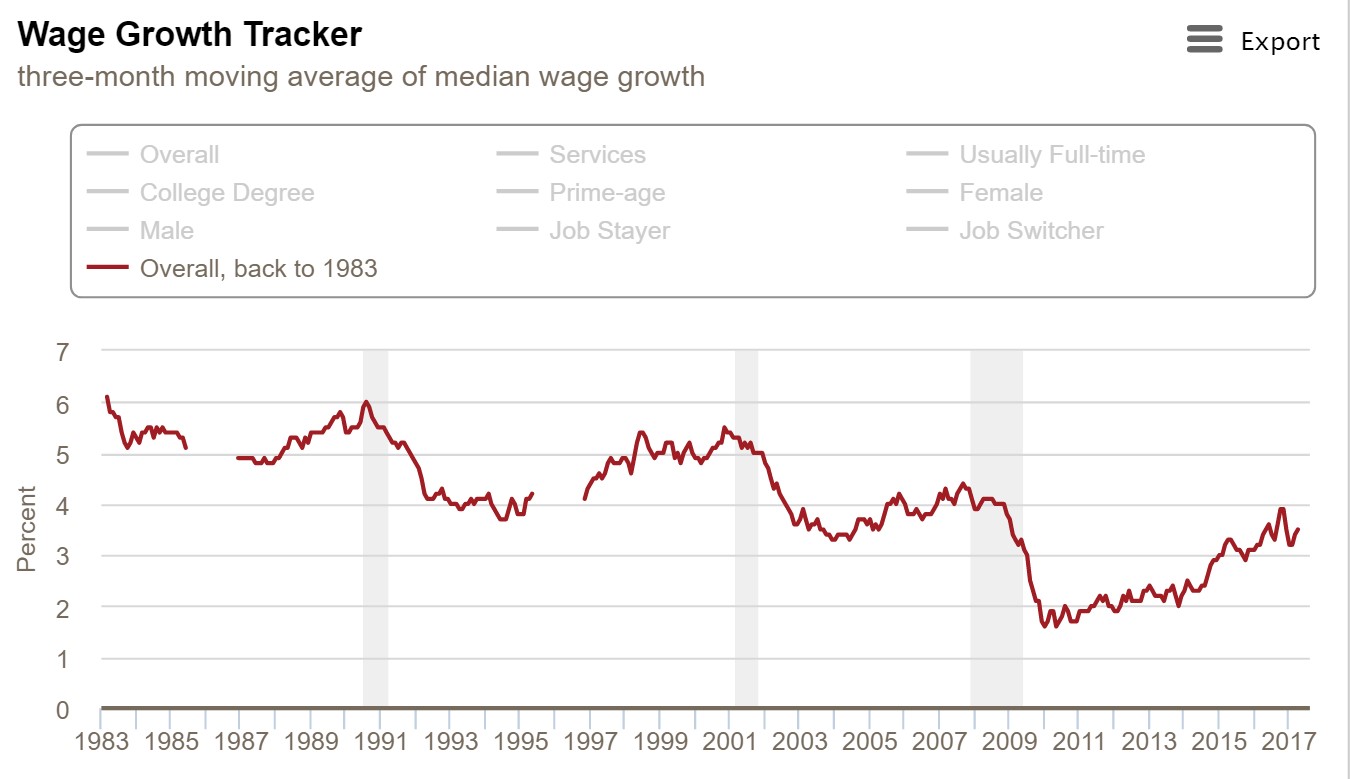
In recent articles, I have been discussing the lack of hourly earnings growth. There is a better way to gauge wage growth than the BLS report. The BLS number uses an average. The average is manipulated too much by high income earners. In this cycle, the lower paid workers have been doing better because of minimum wage increases. Usually minimum wage increases increase unemployment, but with a relatively tight labor market, this hasn’t occurred yet. While politicians tend to ignore economics when making policy decisions, at least their timing was correct in implementing this new policy.
The Atlanta Fed wage growth tracker is better than the BLS report because it doesn’t track the top income earners and it calculates the median instead of the average. This makes the wage growth look a little better. The average BLS wage growth is 2.5% while the Atlanta Fed shows 3.5% growth. The long-term trend is negative as you can see there are lower peaks. However, inflation is also lower so this helps real wages. It’s also worth noting that productivity growth has been decelerating. This means employers can’t afford to increase wages as much as they aren’t seeing efficiency gains.
This all explains why the Fed is raising rates now. The Fed is preempting the inflation which will be coming with the wage growth. The amount of wage growth is solid enough to handle 3 rate hikes this year. While the Fed may be making the correct decision on rate hikes, that doesn’t mean the hikes are without consequence. These rate hikes are going to tighten the lending standards on loans which will eventually cause a recession in the next few quarters. The tightening lending standards on auto loans caused car sales to fall to 16.58 million in May. Car sales are down 9.35% year to date. This will hurt Q2 GDP.
Conclusion
The U.S. macro surprise index is crashing while the Fed is raising rates. While this seems like a recipe for disaster, it isn’t because the Atlanta Fed’s wage tracker shows median wages are up 3.5%. That’s not to say there will be no effect from rate hikes. Rate hikes are going to crimp auto sales which already are having a tough time stabilizing lately. GDP growth will face a headwind from auto sales for the rest of the year. Eventually the rate hikes will cause a recession, but we’re not there yet. For now, the bull market can continue on.