Stocks Always Go Up
This is a great market because no matter what the leadership is on the day, the index almost always ends higher. Last week the momentum tech stocks led the market higher. On Monday, cyclicals did the heavy lifting. S&P 500 rose 1%. It’s still in the range where if it tops soon, this will be considered a double top.
It needs to rally about 10% further to exit that. Nasdaq rose 0.6% as tech underperformed. Tesla was down 1.75% after opening up huge. Apple as up 1.2% after opening up huge as well.
There was a weird open where momentum tech did well and small cap value underperformed. That quickly reversed after about 20 minutes. Small cap value index rose 2.3%. Cloud index fell 0.4% and the airlines index rose 5.6%. As you can see, the recovery plays did well. American Airlines was up 10.6%, while healthcare fell as Humana was down 3%. Healthcare was the only down sector as it fell 0.54%.
Biggest winner was energy which rose 2.75%. Exxon fell after hours as it was replaced in the Dow by Salesforce.com. Dow isn’t important, but this change symbolizes how far energy has fallen as Chevron is the only energy company left in the index.
Cyclical stocks either rose because of optimism about a possible vaccine, the decline in deaths in America below 1,000 per day, hopes about a fiscal stimulus, or because more states are giving out the $300 per week in unemployment benefits from the federal government. There are now 26 states with plans to do so as big states like Texas and New York have joined the fray.
2 states are giving out $400 per week and South Dakota is the only state to refuse benefits. Arizona is the only state that has actually started giving people benefits, meaning the national consumer spending boost will be felt in September, not August.
Bad Breadth
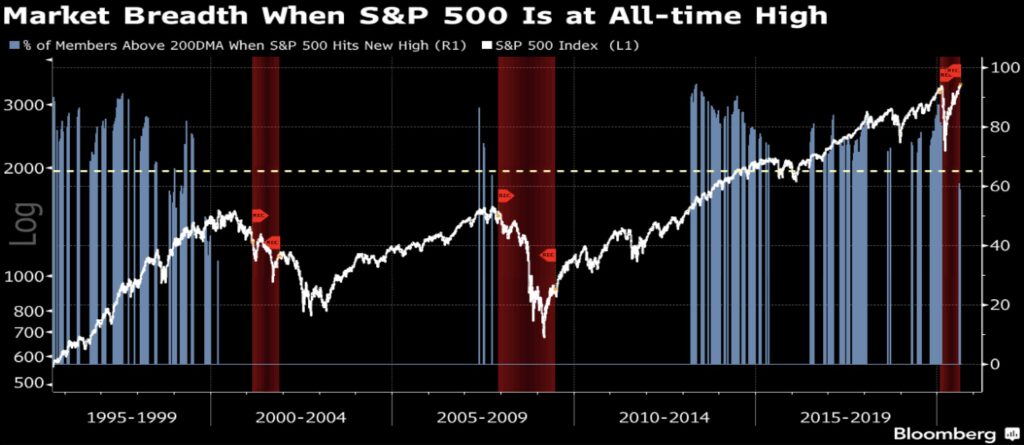
There were 50 new 52 week highs in the S&P 500. Plus, the Russell 2000 was up 1.03%, so breadth was much better on Monday than it was all of last week. That being said, if you take a historical view of this market, breadth is incredibly weak for it being at a record high.
As you can see from the chart below, the percent of S&P 500 members above their 200 day moving average is the lowest since the late 1990s right before the tech bubble burst. In theory, if a vaccine comes out, deaths fall because of better treatment/lower spreading, and a fiscal stimulus passes, we could see cyclical stocks take the reins from the tech stocks in which case the overall index won’t fall 50% like it did in the early 2000s. This is a once in a lifetime event where a stock market bubble is occurring after a recession. Usually, cyclicals do well early in the cycle.
Cheap Without Big Tech
In keeping with the theme that the stock market excluding the momentum tech stocks can do well, the table below shows the S&P 500, without the top 5 biggest names, has a 2021 PE ratio of 18.56. Top 5 firms have PE ratios between 24.23 and 55.43.
Even with the big rally, Microsoft, Alphabet, and Facebook aren’t extremely expensive. Apple, Amazon, and Netflix are the most bubble-like. That being said, if the expensive part of FAAMNG were to crash over 30%, the FAAMNG stocks would fall in kind.
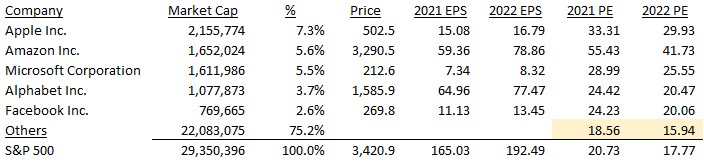
Given how low interest rates are and that we are entering a cyclical recovery, an 18.56 PE multiple isn’t that expensive. If COVID-19 goes away further, we can have a 2nd leg to this recovery sometime late this year or early next year. That spike would be in the most COVID-19 effected areas of the economy such as travel and restaurants.
What Will Happen?
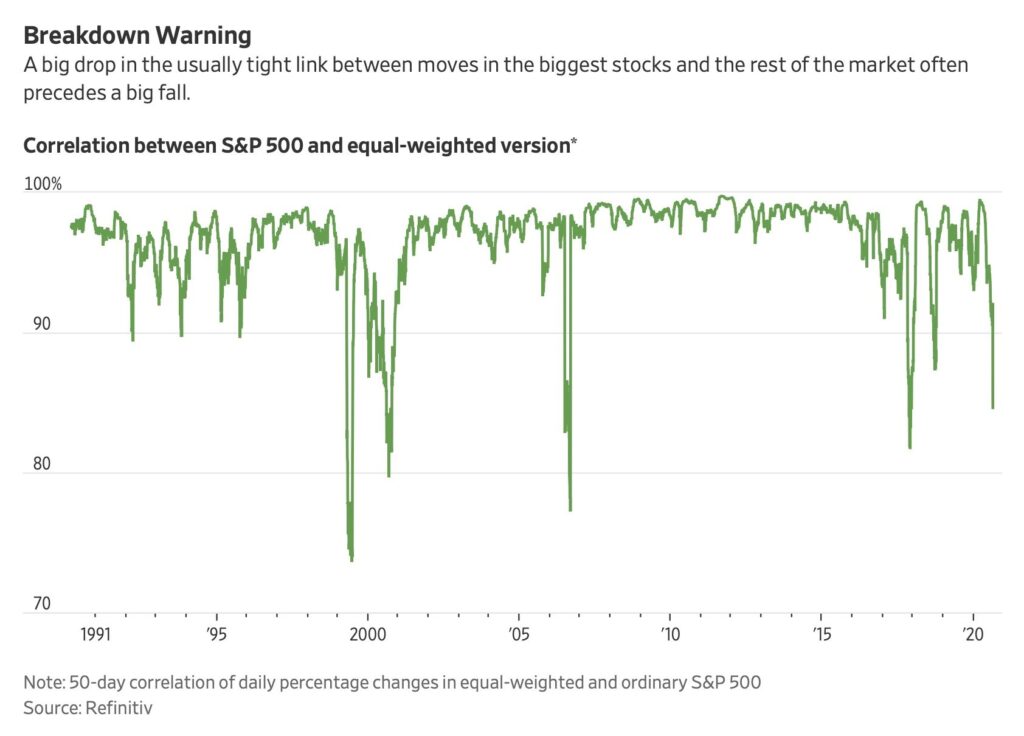
If you see a tech bubble, the question is if you should buy value stocks or raise cash. As you can see from the chart below, when the correlation with the market cap weighted S&P 500 and the equal weighted version declines, it’s a signal a major correction is coming. Question is if this time we see value stocks rally in the midst of a sharp decline in growth similar to the early 2000s.
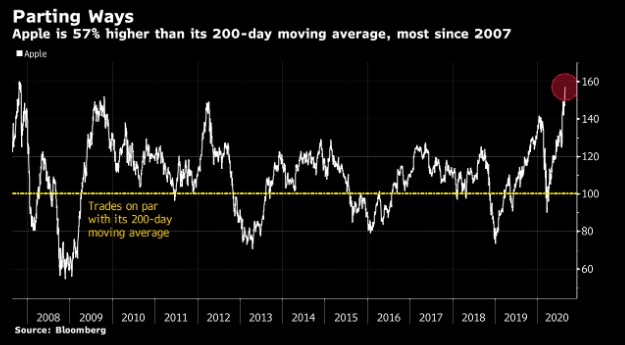
Apple Is A Massive Bubble
The stock market is always crazy, but there usually isn’t a massive bubble in the biggest stock in the market. As you can see from the chart below, Apple is 57% above its 200 day moving average which is its biggest gap higher since 2007 when the iPhone was released.
This year, the first 5G devices will come out, but most don’t think consumers will clamor for the new devices any more than last year. A jump from 4G to 5G isn’t as large as the jump from 3G to 4G. Apple stock has an 81.05 fourteen day RSI. It wouldn’t be surprising if it rallies a little more this week to make this a grand finale in its reign over the market.
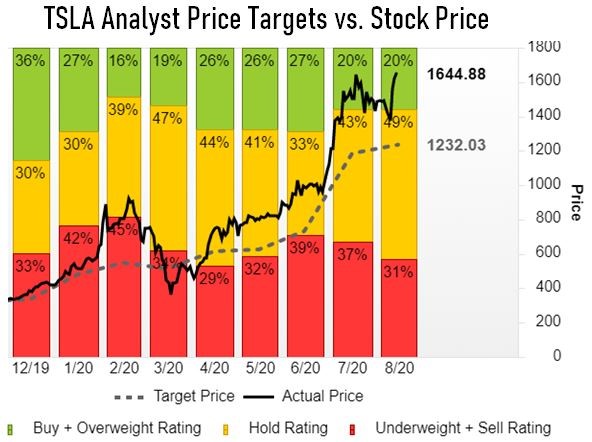
Tesla Boosted By Analysts
Tesla is covered by 30 sell side analysts with price targets. Current average price target is $1,232. Average target on January 1st was $334. As you can see from the chart below, the analyst price target is shadowing the stock price rather than predicting anything. In other words, the price target is meaningless.
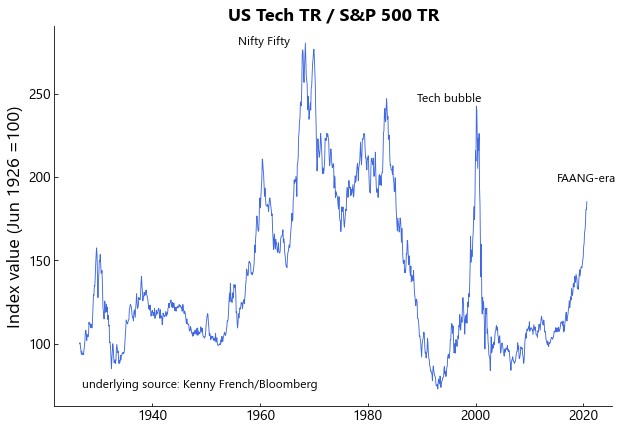
3 Major Bubbles Since The 1930s
FAAMNG is the 3rd major stock market bubble since the 1930s. First was nifty 50 and the 2nd was the 1990s tech bubble. 2000s bubble was in real estate, not stocks. Buying tech was smart in the early 2010s and buying real estate is now a smart idea.
Some favor fading trends when they have gone too far. Investors learned about the importance of valuation every generation. It’s a very painful lesson as returns are terrible for years after the peak. The chart below shows tech returns divided by S&P 500 returns.
It doesn’t look as bad as previous bubbles, but stocks like Amazon and Netflix aren’t in the tech sector. If you include them, this bubble is similar in size to the prior two.