Facebook & Twitter Crash On Boycotts
The stock market sold off sharply on Friday. A selloff was led by the COVID-19 recovery plays and the social media stocks. It’s very clear why the recovery plays declined since COVID-19 is running rampant in the south and the west. However, the decline in social media stocks is new. Facebook stock fell 8.32% and Twitter fell 7.4%. Facebook has a market cap of $615 billion, so this decline was a huge deal for the market.
These stocks fell because companies pulled back advertising because of a lack of monitoring on their platforms. This same issue happened to YouTube a few quarters ago when companies didn’t want to run ads in front of non-politically correct videos. YouTube then made it harder to monetize a channel.
Companies such as Unilever that are stopping ad spend on Facebook and Twitter have a good point. They don’t want to support content that makes their brand look bad. A problem Facebook and Twitter face is that politicians might get mad if they censor posts. This is going to increase the cost to run a social network because there will need to be more monitoring.
On the other side, regulations increase these firms’ moats. They already have strong network effects, so you can argue they don’t need another moat.
One other important point is these companies that are boycotting Facebook and Twitter were already cutting spending because of the recession. This is like quitting a job you were already fired from. Coca Cola announced it is cutting spending on all social media platforms.
Honestly, this isn’t only about social media policies. It’s more about the urge to cut costs. Why advertise to people who aren’t going out anyway? Every time a new company joins the boycott, social media stocks will fall which means they might not be done falling.
Oversold Already?
Investors are not bearish on the stock market if you exclude the internet stocks. CNN fear and greed index fell 4 points to 45 which is neutral. Put to call ratio is the highest since May 1st which suggests the market isn’t overbought anymore. However, if COVID-19 keeps getting worse we could see stocks get oversold which means another 3% to 5% decline in the S&P 500.
Many are actually bullish on the median stock and small caps. We just don’t like the mega internet names and the bubble cloud stocks. Basically, this includes almost all of the tech sector and some of communication services and consumer discretionary. Remember, software ate the world, so when these stocks fall, it can bring the whole market down.
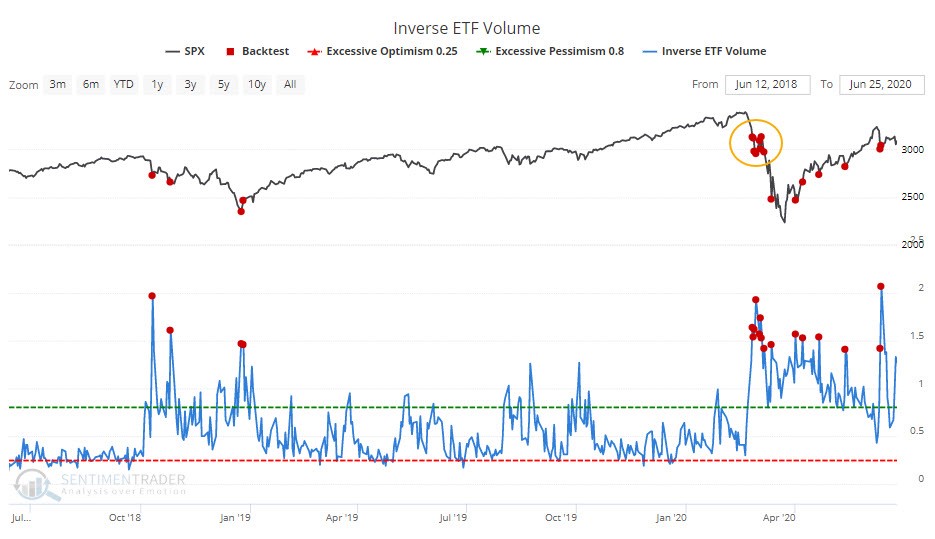
As you can see from the chart below, inverse ETFs like QID and SH are seeing an increase in volume as they accounted for 1.5% of total volume. That usually is a sign of a short term pessimistic extreme except for the worst part of the bear market. On the other hand, even if stocks bounce slightly, it doesn’t mean the trend isn’t lower.
Increasing Correlations
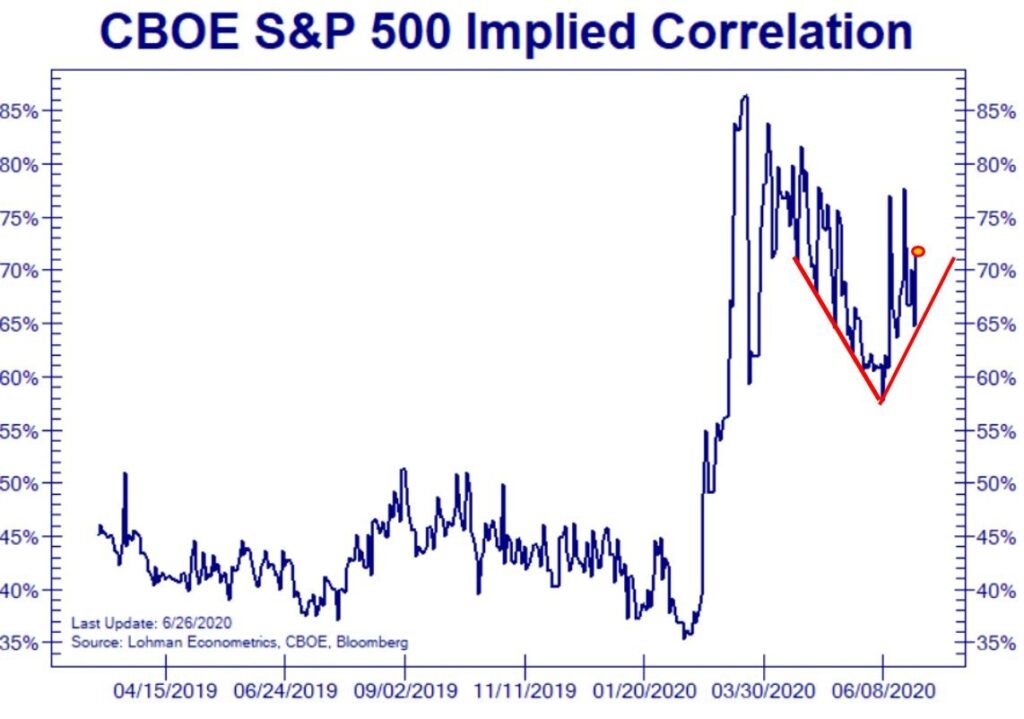
Best signal that the bottom was in on March 23rd was that correlations were high. That means every asset was being treated the same. Worst and the best stocks were being sold in a massive rush to the exits. When such panic occurs that investors don’t think about what they are selling, it’s a sign of a bottom.
As you can see from the chart below, correlations have been rising which could be a good signal to buy stocks now.
Big Caps Have Been Dominating
SPY – RSP (equal weight S&P 500) spread peaked at 980 basis points on May 15th. It then narrowed to 231 basis points as the median stock outperformed the big firms. It has widened back to 790 basis points as the big firms have been outperforming recently. If you don’t own FAAMNG, your portfolio has been struggling.
Equal weight index, the Russell 2000, the S&P 400 (mid cap), and the equal weight mid cap index are all down 14% to 17%. S&P 500 is down 5.8% which gives it about a 10% outperformance. Large caps have been doing very well. QQQ which is the Nasdaq is up 13.4% which gives it almost a 30% advantage over the median stock.
Cloud Stocks Are Overbought
Usually since cloud stocks have a high beta, they fall more than the market when it’s down viciously. However, in the past few months, the cloud stocks have been outperforming to the upside and the downside. This is a recipe for a bubble. On Friday, the CLOU cloud ETF was down just 0.75% even though the S&P 500 fell 2.42%.
Nasdaq fell 2.59% because it was brought down by the social media stocks. Social media stocks aren’t in the cloud index. If you told me how much the S&P 500 and the Nasdaq were down, I would have guessed the cloud stocks fell 4% on a normal day. However, this is an abnormal bubble market for cloud.
Shopify stock only fell 0.69% even though it hit a record high on Thursday. Fastly stock was up 5.93%. It’s up 85% since June 12th. These are the types of gain seen in the tech bubble in the late 1990s. It now has a $9 billion market cap. It’s a mid cap firm for now. Fastly has a 34 price to sales ratio which puts it ahead of Cisco and Microsoft at their peaks in 2000.
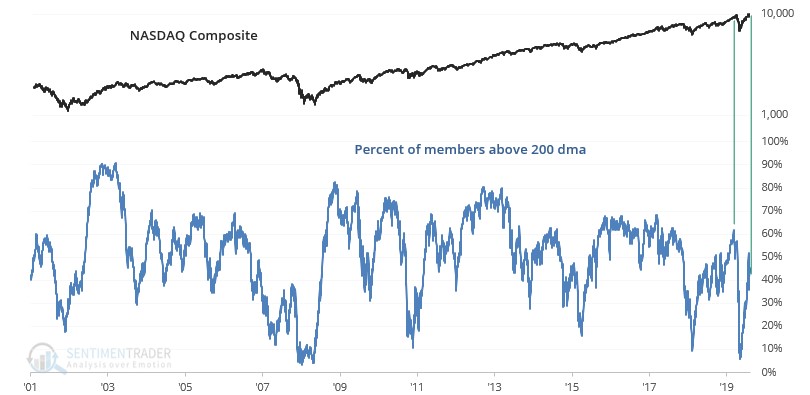
As you can see from the chart below, as of June 24th the Nasdaq was 16% above its 200 day moving average even though only 45% of its components were above their 200 day moving average. Only other time this has happened is in February 2020 which was right before the bear market crash. One difference now is breadth is worse. It’s about 10% lower.
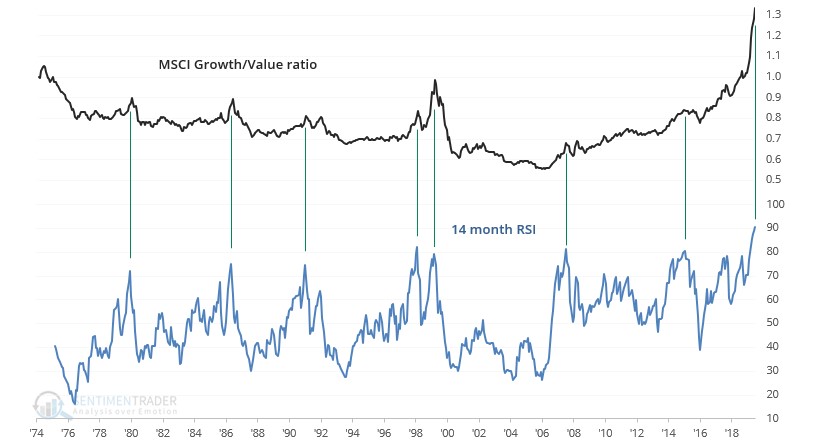
With interest rates being so low and retail investors getting involved in stocks, there has been euphoria in growth stocks. As you can see from the chart below, the MSCI world growth to value ratio’s 14 month RSI hit its highest level ever. It’s even above the peak in 2000. Growth and tech stocks are overvalued.