Slowing Economy - Economic Growth Is Slowing
Before getting into the economic data from last week about the Slowing Economy, let’s get a baseline understanding of how the economy is doing. In June, the ECRI coincident index’s growth rate was 1.6%. It bottomed at about 1% in 2016.
Real yearly GDP growth has been falling, but real final sales growth was solid in Q2 which implies nominal growth will pick up in the 2nd half. Based on the recent economic data since the advanced Q2 GDP report was released, I expect the first revision to show slightly lower growth. Real quarter over quarter GDP growth will likely have a one handle after all.
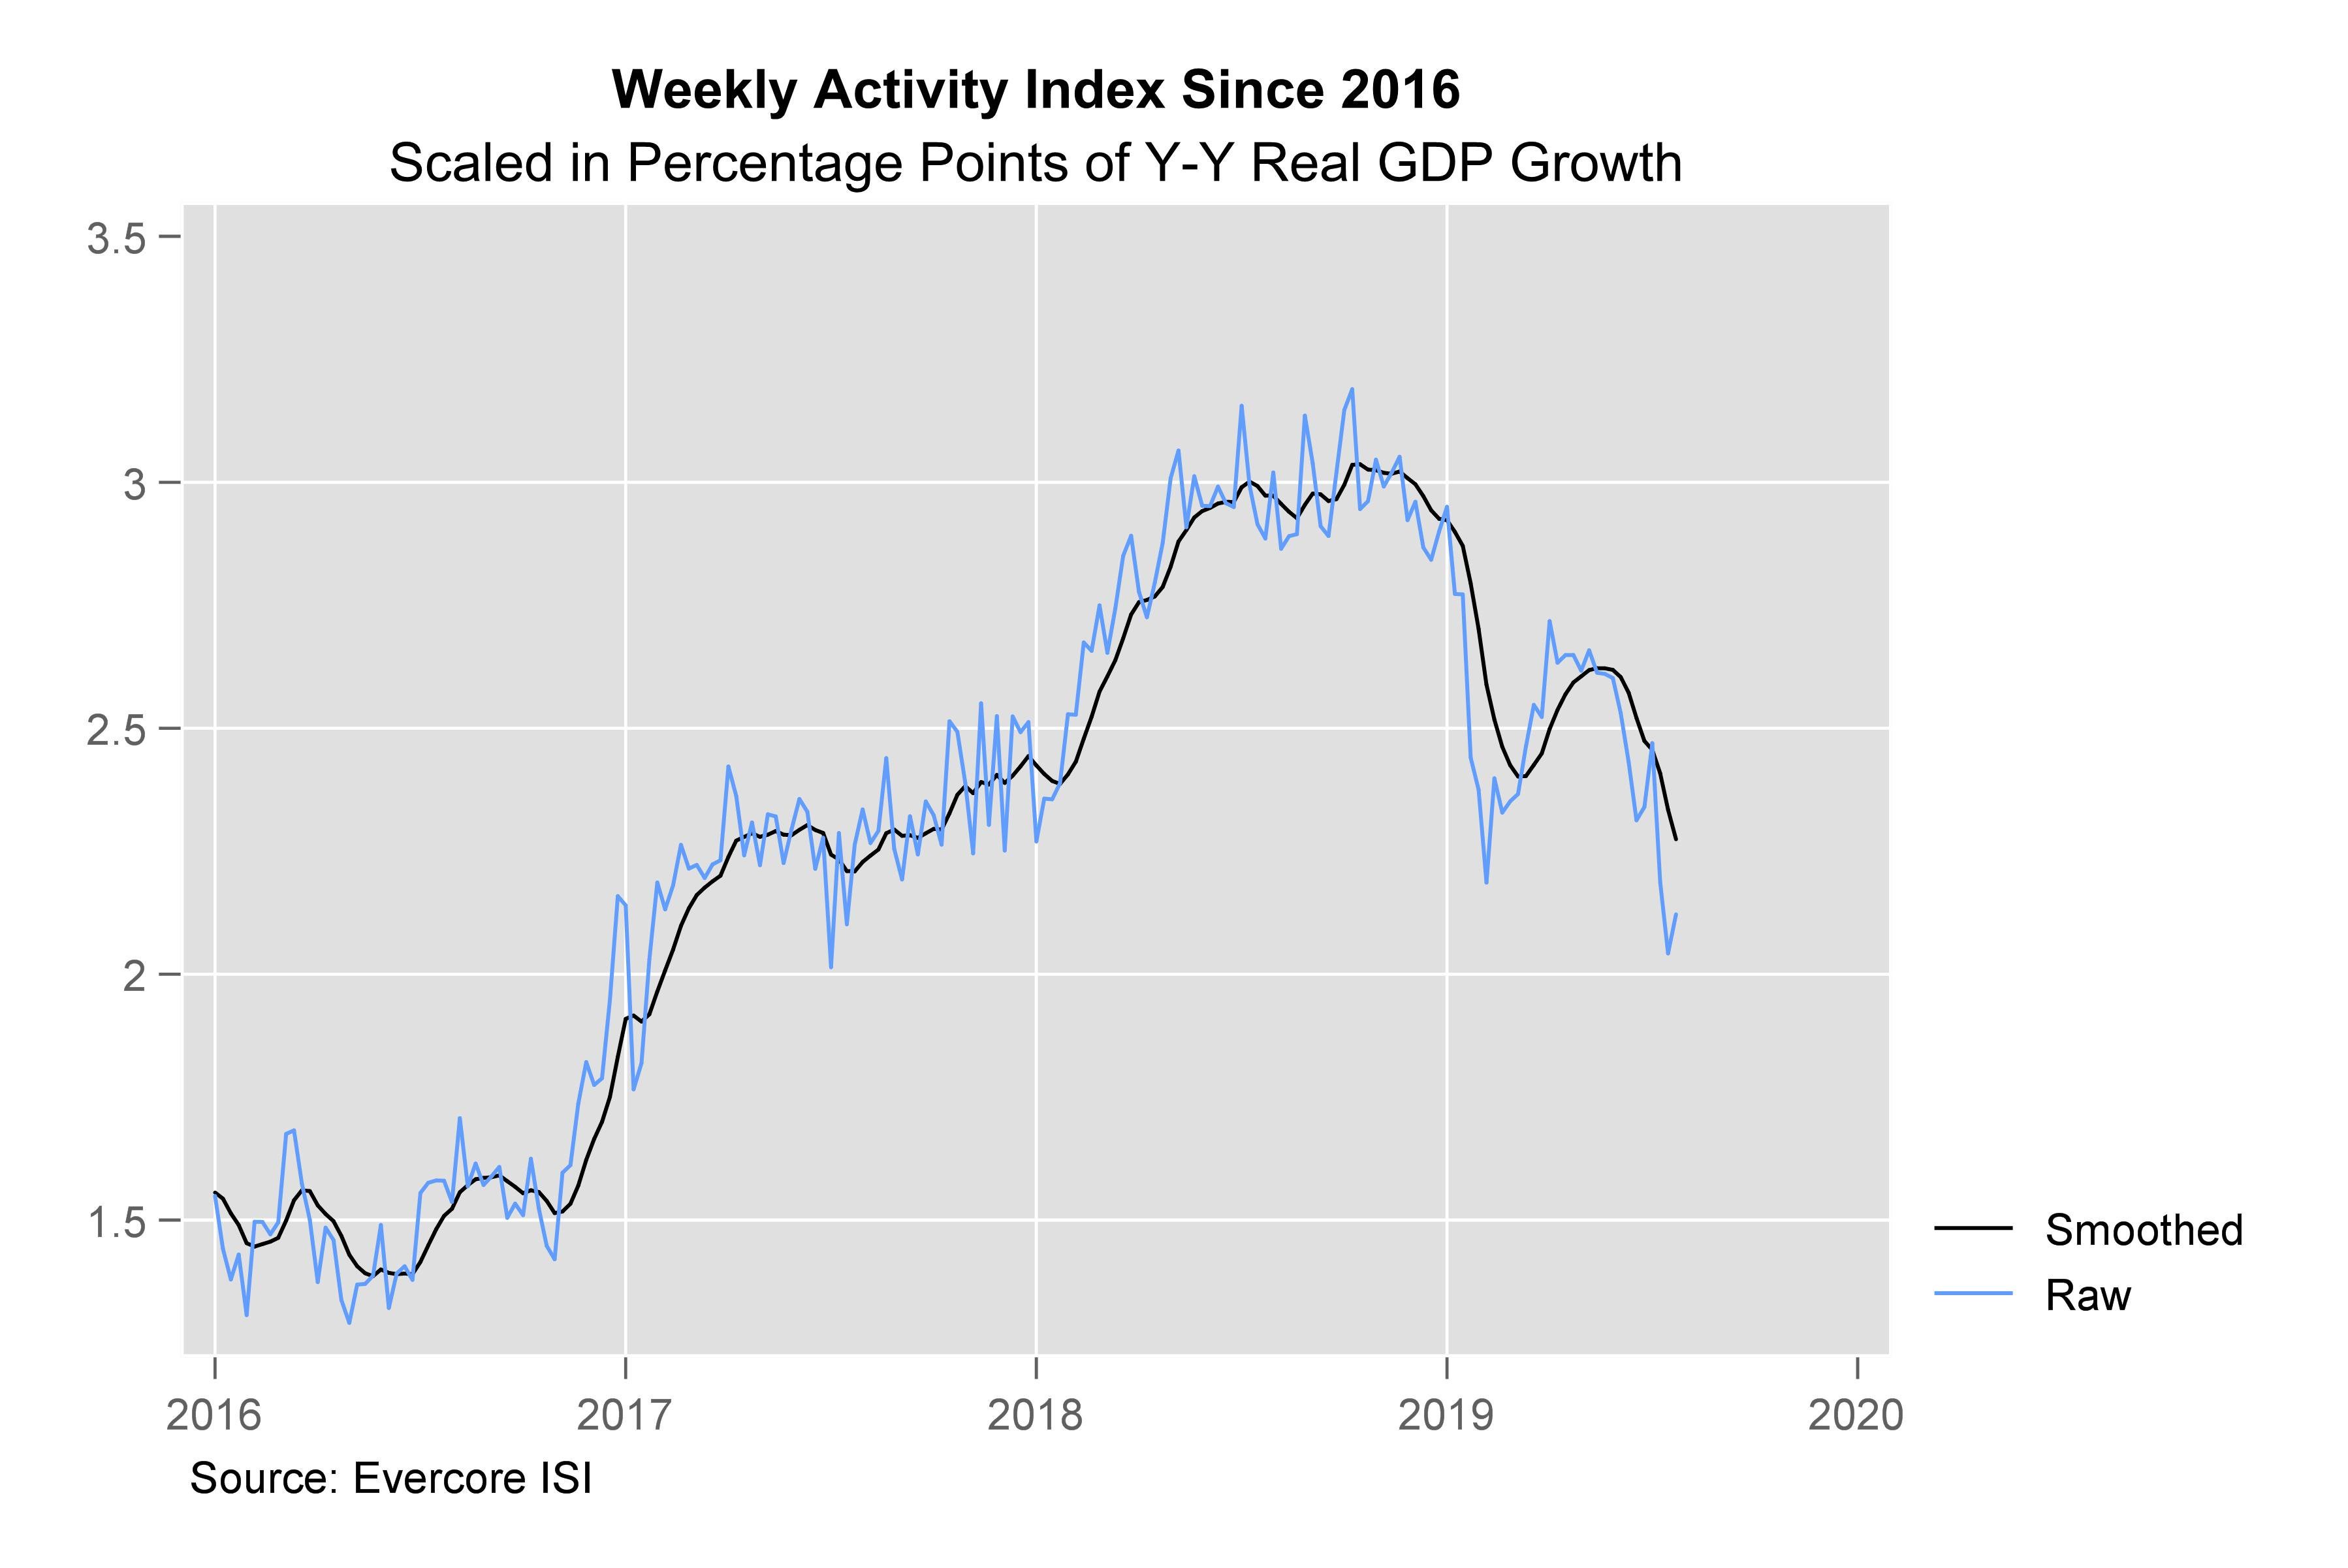
Consumer and labor markets are doing well, while the manufacturing sector is underperforming. Manufacturing either has slightly positive growth or slightly negative growth depending on which data you look at. This brings us to the weekly activity index seen in the chart below. It uses updated data scaled in real yearly GDP growth.
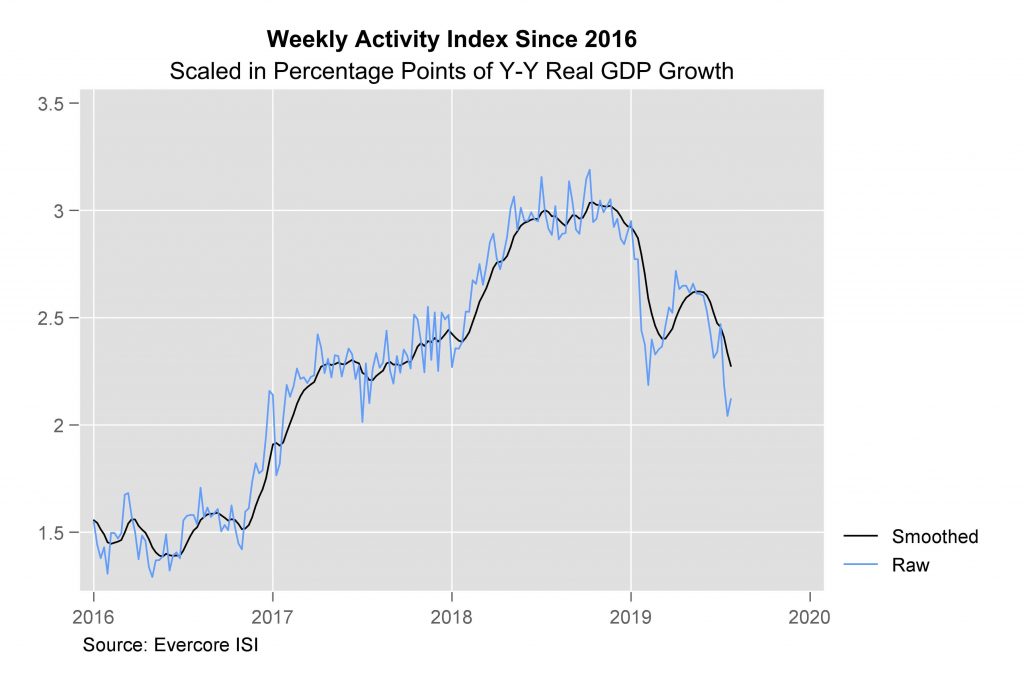
As you can see, the smoothed growth rate has been in decline since the end of 2018. It had a small bump earlier in the year.
Smoothed Growth Rate is now at the lowest point since 2017.
Slowing Economy - The economy wasn’t terrible in 2017. But the negative rate of change implies growth will get closer to the low seen in 2016. This probably isn’t the worst slowdown since the financial crisis, but it might become the worst one soon.
ECRI leading index, which implies growth will improve modestly by the end of the year, is a black box. It is a proprietary index. The chart above isn’t. It is calculated using jobless claims and intermodal freight transportation. And also consumer comfort, Redbook, federal taxes and spending, retail sales, and oil prices. Cass Freight index is the most bearish economic report I’ve seen. I will be reviewing each month’s data closely.
Slowing Economy - Decline In Job Cuts
Earlier in the year, the Challenger Job Cut report was a big issue as it implied there would be a spike in jobless claims. Initial claims have been very stable, although, there has been a decline in job creation growth in the BLS report.
Decline in job creation growth is a combination of cyclical weakness and the fullness of the labor market. Job cuts in the first few months of the year implied a recession could occur soon. While the data in the last few months hasn’t been nearly as bad. In July, job cuts fell from 41,977 to 38,845.

The chart above shows yearly cut growth job. There was a 43% yearly increase in job cuts in July. This chart is a bit misleading. It highlights the increase in yearly growth since 2017.
However, the 6 month moving average growth rate is down from earlier in the year. You can see each of the past 3 spikes has been lower. Job cuts in July 2019 were the lowest since August 2018.
Industrial goods announced 4,403 layoffs which is the most out of any industry. It has been the highest throughout the year. This weakness makes sense. Industrial production growth has been declining. This report blamed 1,000 layoffs on tariffs. That’s obviously miniscule, but unfortunately that amount will grow in the next few months as the trade war intensifies. It’s possible that the overall total falls, but the impact of tariffs gets worse.
Another Solid Jobless Claims Report
Slowing Economy - In the week of July 27th, jobless claims rose from 207,000 to 215,000 which was 1,000 higher than estimates. 4 week moving average fell again. It went from 213,250 to 211,500. Continuing claims rose 22,000 in the week of July 20th.
4 week moving average increased slightly to 1.698 million. A very low jobless claims total wasn’t perfectly in line with the July labor report. But it wasn’t wildly off either since the BLS report was ok.
On a population adjusted basis, claims have been indicating the labor market is stronger than it is because it’s harder to file for benefits in certain states. That’s not a new phenomenon though.
Slowing Economy - Slightly Improved Markit Manufacturing PMI
Full month Markit manufacturing PMI fell from 50.6 to 50.4 in July. But the reading in the 2nd half of the month improved from the first half. Mid-month reading was 50 and the final reading was 50.4. That means the PMI increased from 50 to 50.8 from the first half of the month to the 2nd half.
This minor improvement shouldn’t have made markets think the Fed was going to cut rates suddenly when it was released on Thursday. However, don’t confuse this with a good report. There was weakness throughout it.
Employment index fell for the first time since June 2013.
Slowing Economy - Output expectations were the weakest since July 2012 when the calculation was started. Purchase activity index fell for the first time since April 2016. Based on Markit’s survey this is the worst manufacturing slowdown since 2009. Goods producing sector is about to drag GDP growth lower in Q3 if it continues on this pace.
Comments section of this report stated, “manufacturing production is declining at an annualized rate in excess of 3%.” While it’s good to see slightly better results in the 2nd half of July than the first half, one must wonder if the manufacturing sector will weaken further.
Especially now that trade tensions with China have escalated. For a brief period, firms became optimistic about trade because negotiations restarted. That optimism appears to have ended quickly.
Slowing Economy - Conclusion
Labor market is doing fine while the manufacturing sector is headed in the wrong direction. Manufacturing sector is a leading indicator and employment lags. However, manufacturing has been weak 2 other times in this expansion and a recession didn’t follow.
Also, job cuts and jobless claims are supported to be leading indicators. Job cut announcements happen before cuts are enacted. There is nothing to worry about in the Challenger report. Yes, job cuts were up yearly, but they were also the lowest in 11 months. The total isn’t as worrisome as it was earlier this year.