Wal-Mart Margins Shrink
Wal-Mart stock fell 2.75% on Wednesday as the stock is in complete free fall. It’s down 16.46% since January 29th. I don’t think the selloff in Wal-Mart signifies overall weakness from the consumer because the same store sales growth was fine. There are 3 main causes of the decline in WMT. The first is that it ran up way too much prior to the quarter. From January 27th, 2017 to January 26th, 2018, the stock acted like a momentum tech name as it was up 65.08%. For a company which grows revenues in the low single digits, that makes no sense. The other reason, which I mentioned previously, was the sharp deceleration in online sales growth.
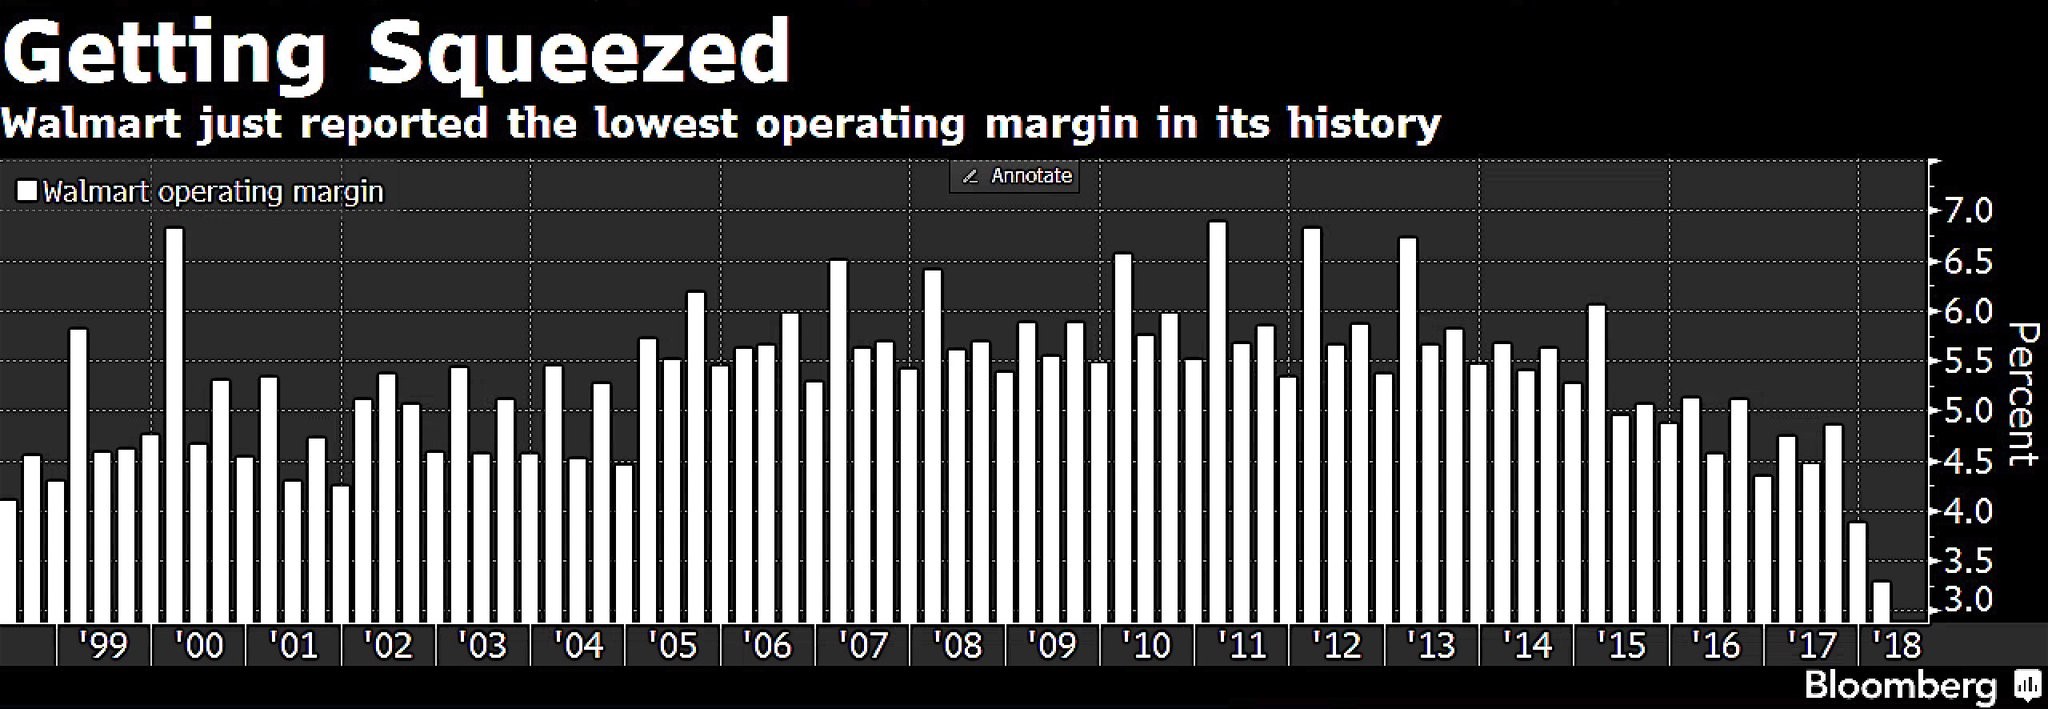
The third reason can be seen in the chart below. With the increases in the minimum wage and the competition from Amazon, the firm just reported its lowest operating margin in its history. This information matches perfectly with the stock having its worst day since January 1988. This is all good news for the consumer since it means they get better wages and lower prices because of competition and the advancement in online retail.
Moderately Bearish Sentiment
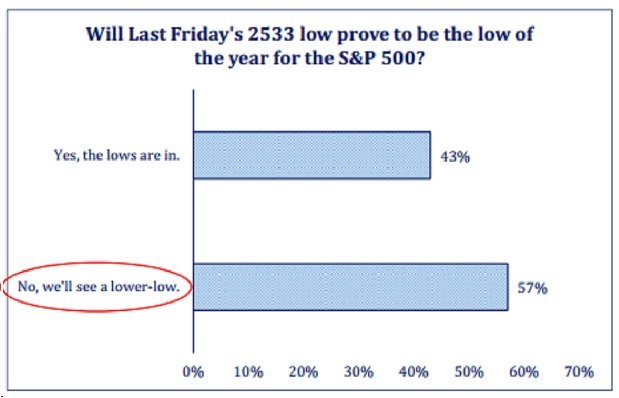
The sentiment had been euphoric for over a year, but it has changed recently. I think this is great news because the faster the sentiment changes, the more likely the market will make a new high. The poll below supports the point that being bearish is popular. As you can see, 57% of respondents think the market will make a lower low than 2,533 on the S&P 500. This market appears to be technically driven. There isn’t much of a fundamental reason why stocks should go lower. I wouldn’t rule it out obviously. The potential for a re-test of the lows dominated trader’s conversations. If the low holds, it’s a bullish sign and if it doesn’t, the market could fall to 2,400.
Stock & Bond Correlation
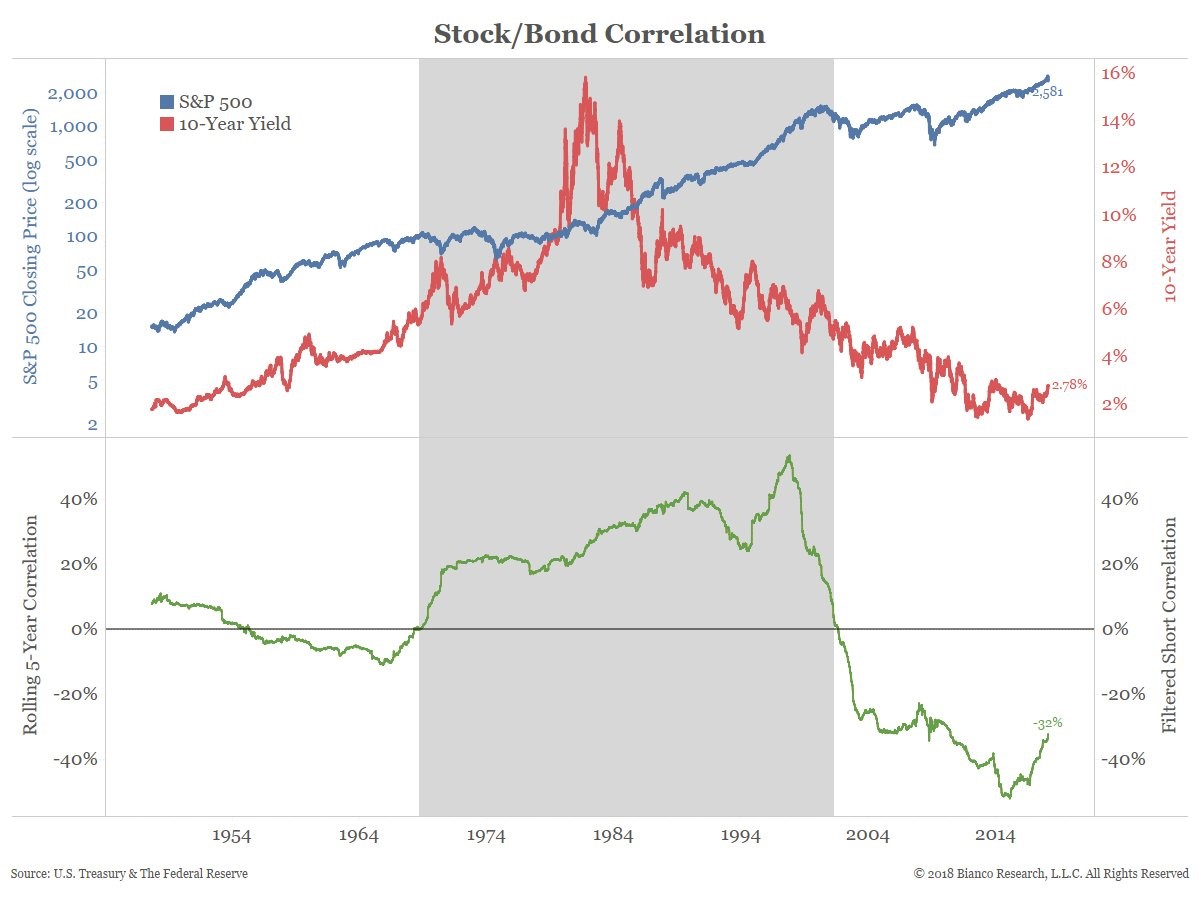
As I mentioned in a previous article, the S&P 500’s correlation with the 10 year bond yield is tough to gauge because sometimes it’s correlated and sometimes it isn’t. The near term action is similar to the long term action. As you can see from the chart below, the rolling 5 year correlation has moved back and forth. It’s crazy to say the 10 year yield is causing stocks to fall since it doesn’t come close to always moving in the opposite direction of the stock market. That being said, I’m bullish on stocks and bullish on treasuries. In that situation, yields and stocks would be inversely correlated.
Long Term Optimism Is Still High
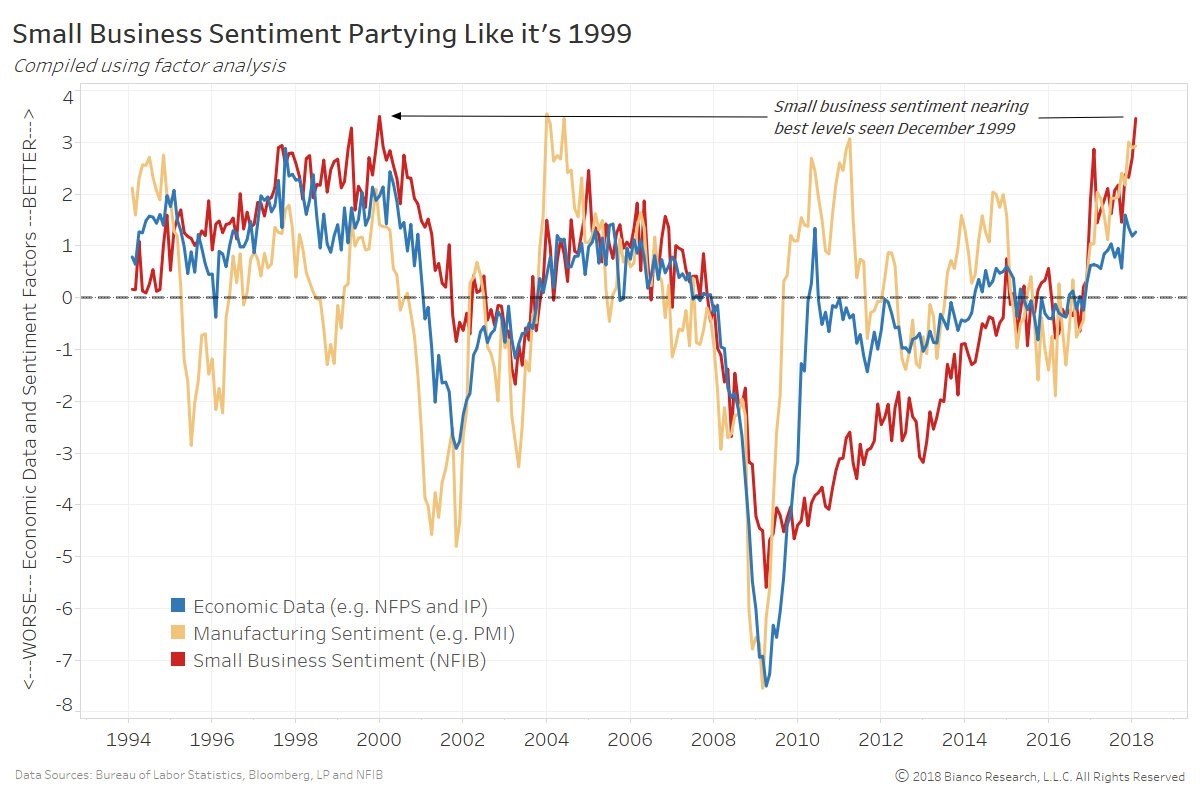
The expectation for near term stock performance is negative, but small businesses and other economic sentiment reports show intermediate term optimism. This is proof that sentiment reports generally reflect the recent past. We just saw a correction in stocks and the economy has been strong in the past 12 months. That’s why sentiment reports are often faded. That being said, I don’t have any information which makes me think stocks can’t go down another 4% to re-test the lows. I am bullish on stocks for the next 12 months and would be slightly more bullish after that decline. Secondly, the chart below shows how sentiment reports often mark the top, but sometimes optimism lasts a few years before the crash. Sentiment reports are optimistic the year before a recession, but they don’t tell us when that will be. My takeaway from this chart is simply that the economy is late cycle, not that a recession or bear market is coming in 2019 like the title implies.
Short Treasuries Trade Explodes
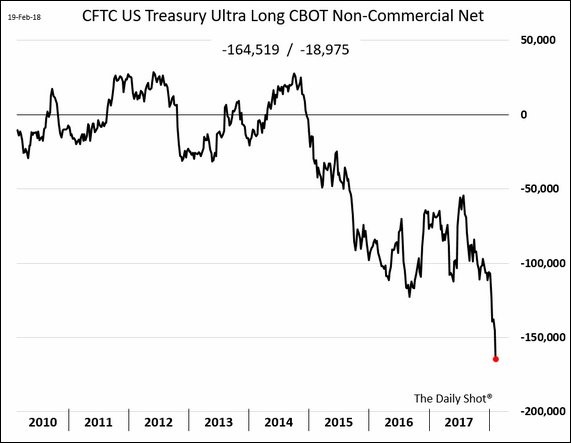
I think the short treasuries trade is comparable to the short VIX trade earlier this year; it will end in an unwind where the trend will have a sharp reversal. The 10 year yield has gone up so quickly, that even as someone who believes growth and inflation will increase this year, I think it has gotten out of hand. Just like how projections for full year stock returns were beat in January, the 10 year yield is reaching projections in a similar time frame. It will be interesting to see if 3% acts as resistance since that was the 2014 peak. As you can see, the CFTC U.S. treasury ultra long non-commercial futures have the highest net short position ever. It’s impossible to say exactly when yields will peak, but it will occur in the next few weeks. The faster yields increase, the more likely and the sooner the decline will occur.
Inflation Is Baked In
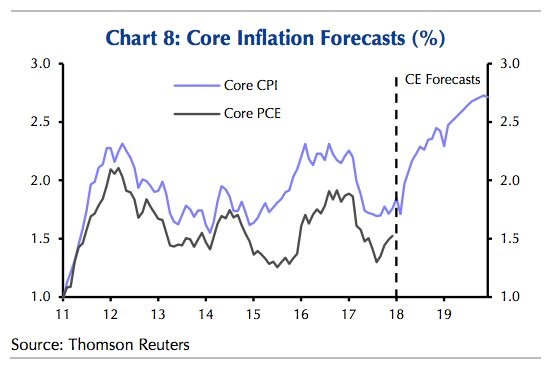
It’s important to note that in the past few months, the markets have priced in an increase in inflation. If you are bearish on treasuries because you think inflation will increase, recognize that an increase is already expected. Inflation needs to beat the heightened expectations for that trade to go well. The chart below shows that core CPI is expected to increase to 2.7% in the next 18 months. I think that’s a reasonable estimate, but I’d be surprised with anything higher. Inflation is fickle as we saw in 2017. I wouldn’t short treasuries because I don’t have a high level of certainty that inflation will skyrocket. If you don’t want to go long treasuries, you can buy utilities for the same trade. Since November 14th the S&P 500 utilities sector has gone from $287.82 to $246.68 which is a 14.3% decline in 3 months.
Conclusion
The narrative on yields causing stocks to sell off is dubious. If the inverse relationship between yields and stocks exists, stocks will rally in the next few weeks because I expect yields to decline because the trade is overcrowded. You can’t short treasuries just because you think core inflation will accelerate to 2.4% this year because that’s already in the estimates. The fundamentals support higher yields just like the fundamentals supported higher stock prices in January 2018, yet there was still a correction in stocks and their will be a correction in the short treasuries trade. Any data point which shows tepid inflation can catalyze this trend correction.