Tax Reform Pushes Stocks Higher
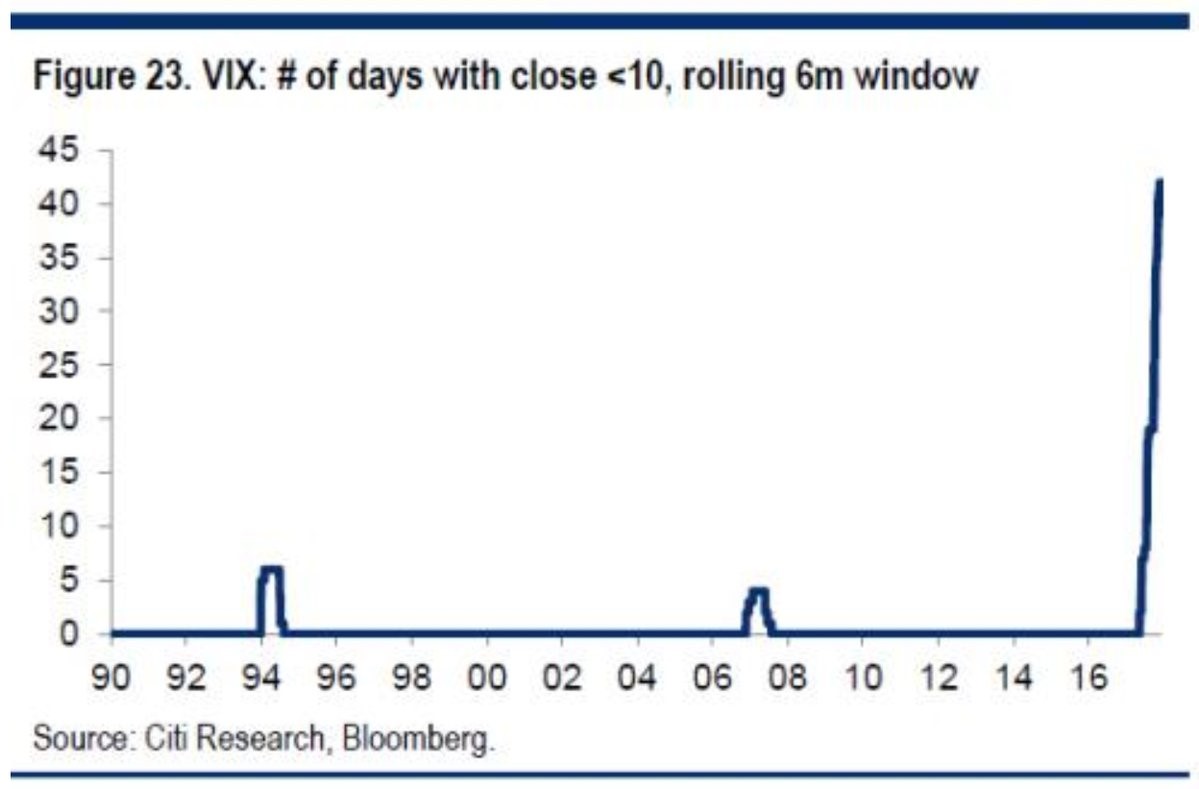
The stock market had a huge day on Tuesday as the Dow had its 61st record high of 2017. The Dow was up 1.09% and the Russell 2000 was up 1.53%. The S&P 500 was up 0.98%. It has been above its 200-day moving average for 358 days which is the 4th longest streak since 1957. The 2nd and 3rdlongest streaks were 385 days, meaning a Santa Clause rally could help make this the best rally since the 475 day streak from 2012 to 2014. To get an idea how far volatility has fallen, the chart below shows a 6 month rolling window of days where the VIX was below 10. As you can see, there has been over 40 days with the VIX below 10, while in the 1990s bull market the total peaked at 6 days.
The reason this was such a great day was optimism about the possibility of the GOP passing tax reform. The two Senators who stated they might oppose the bill, Corker and Johnson, voted to advance it, increasing the odds it will pass. The chance of an individual tax cut being passed this year is at 38% on the PredictIt betting website. The chance of a corporate tax cut passing increased by 18% on Tuesday to 58%. This is the first day the odds were above 50%. The two Senators’ support for the bill allowed it to be advanced by the Budget Committee in a vote of 12-11.
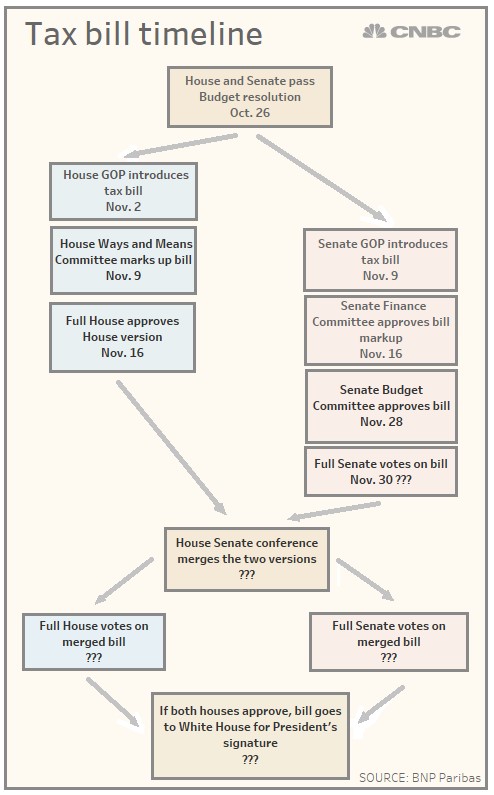
This procedural vote means the plan might be voted on as early as this week. If it passes the Senate, the House and the Senate will need to come together to reconcile their differences. The chart below shows the process the tax bill needs to go through to be passed. The next key day will be the full Senate vote which might be Thursday. This will be the biggest test this bill has needed to face so far. If it’s successful, I expect the odds to get close to 75% for a corporate tax cut by the end of the year. This is great for stocks which are now up 17.34% for the year. Along with the tax cut, some money managers are playing catch up, trying to window dress their portfolios by buying the winners of the year to make it look like they were smart. This could help push the S&P 500 to close up 20% for the year.
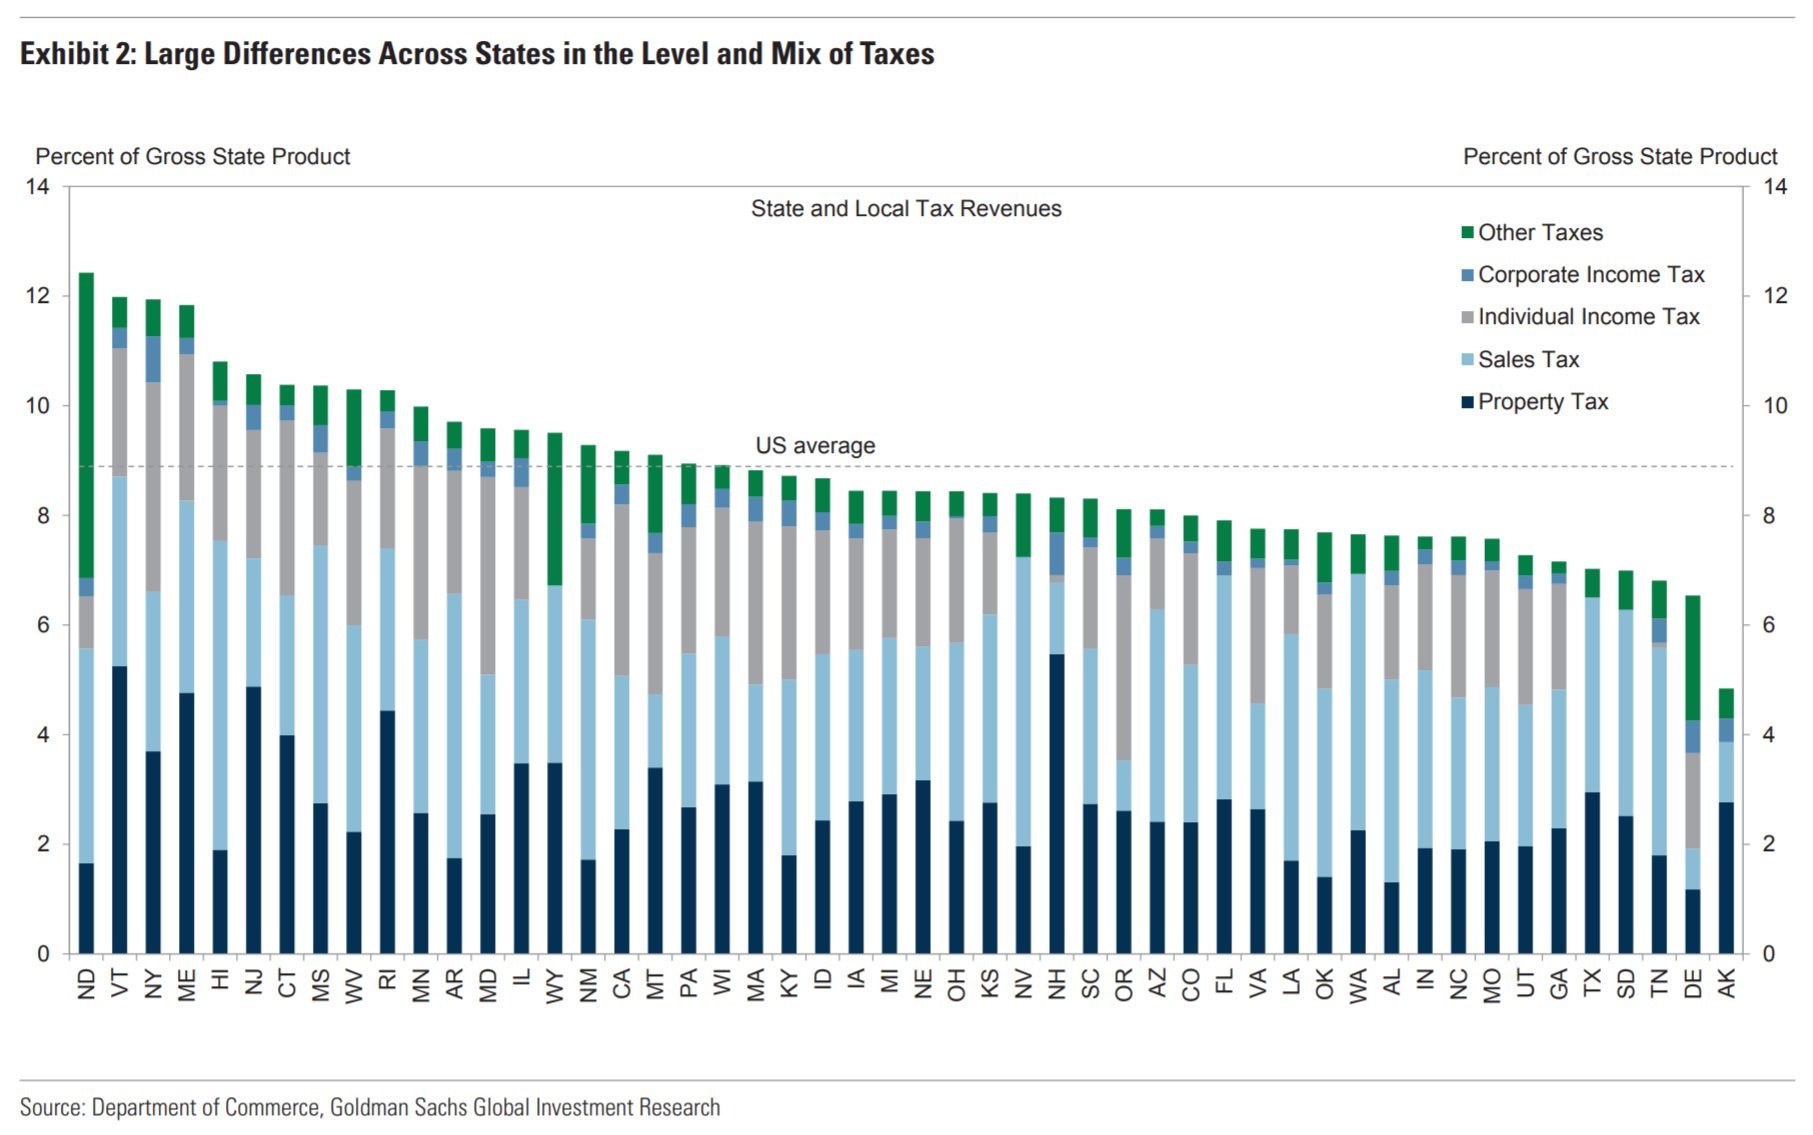
As we have previously discussed, the states with the highest taxes are going to be burned by this tax plan because the ability to write-off state taxes will be either eliminated or severely restricted. As you can see from the chart below, the states with the highest taxes collected as a percentage of their GDP are mostly in the northeast. Any retailers who operate mostly in the northeast will probably be hurt. We will might see some people leave these states; some of these states might lower their tax rates to be more competitive. We will get the final details of who the plan will help and who it will hurt after it is passed. One of the biggest unknowns about this plan is how much it will add to the debt. According to the estimates, it will add about $1.5 trillion to the debt over the next 10 years. The key will be how much it helps the economy grow. Growth helps to mitigate deficits as workers and corporations pay more taxes. It will probably end up being lower than the $1.5 trillion added, but it might not get back to even. A lot of this math will depend on the business cycle. A big recession in 2019 could blow a hole in the federal government’s budget. Like I have been saying, a tax cut in 2018 will mean there won’t be ammo to help the economy if there’s a recession in a few years.
Economy Is Still Healthy
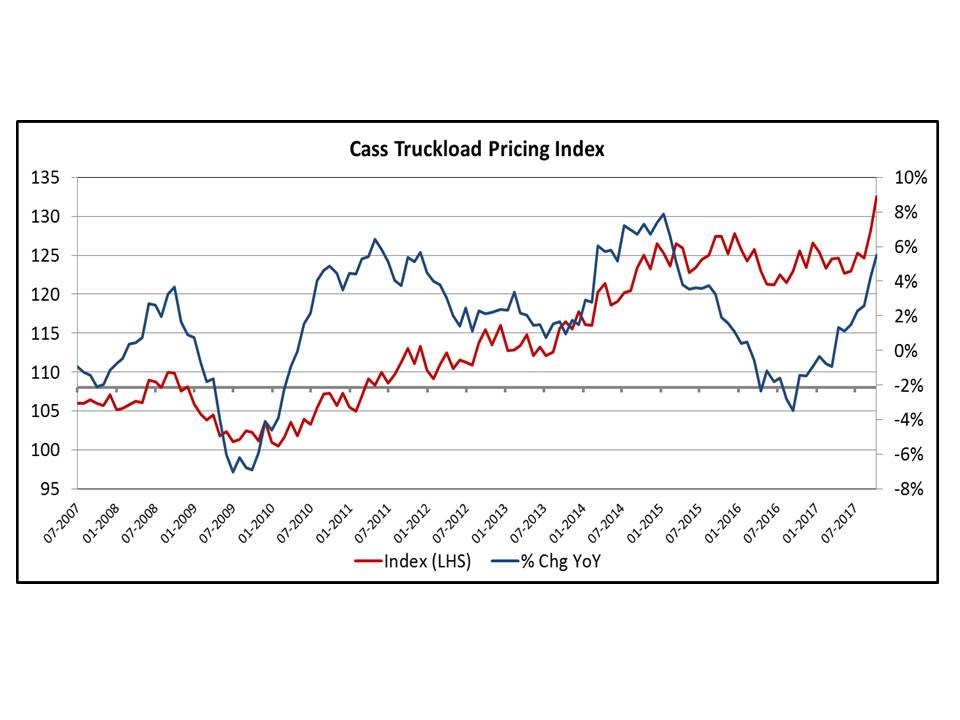
The prospect of a recession in the next year is remote, which supports the notion that this economic stimulus isn’t happening at the best time. To support the notion that the economy won’t fall into a recession in the next year, the chart below shows the latest Cass Truckload Pricing Index. As you can see, the index is seeing the fastest growth rate since early 2015. It took about a year and a half to go from the peak growth rate to negative growth, so if the growth immediately turns around now, the next recession would still be in 2019. The growth would need to fall lower than it did in 2016 as that didn’t signal a recession was afoot.
The Markit PMI Flash Composite in November, which was released on Friday, showed some weakness, but nothing close to a recession. The output index fell to 54.6 which is a 4 month low. The services business activity index fell to 54.7 which was also a 4 month low. The manufacturing PMI fell to 53.8 which was a 2 month low. Finally, the manufacturing output index fell to 54.3 which is also a two month low. An increase in demand helped create a situation where payrolls were strong. This helps us get a feeling for how the BLS employment report will look next Friday. According to the Markit commentary on the November report, the PMI reading is consistent with GDP growth just over 2% and employment growth in November of just over 200,000 jobs. That level of job creation would be fine. It will be interesting to see if that causes the unemployment rate to fall below 4%. GDP growth of just over 2% would be disappointing as most forecasts see 3% growth or higher. This GDP commentary should be taken with a grain of salt because it’s only one month out of the three months in Q4. No one will have an accurate understanding of where Q4 GDP growth will be until January. Speaking of GDP growth, the first revision to the Q3 report will come out on Wednesday.