Market Ends Great Weak & Subpar Month
The stock market ended up marginally on Friday which closed an amazing week and the 2nd down month of the year. The S&P 500 was up 6 basis points on Friday and 2.79% on the week. The trading session was interesting much like it was this month. The S&P 500 opened the day higher; it was up 0.52% at its peak. Then from its peak to late in the morning, it fell 0.85%. It rallied slightly by the end of the day, managing to close up barely. It didn’t close up for the month though as it fell 1.81% in August. That’s a relatively small decline compared to what could have occurred. The market is in the middle of its recent correction range. Even though the tariffs are set to go into effect start on Tuesday, investors are optimistic about a possible trade deal.
Specifics Of The Trading Session
The Nasdaq and the Russell 2000 both fell 0.13%. The VIX was up 1.1 to 18.98. It was up because of the morning volatility I discussed. The CNN fear and greed index fell 3 points to 23 which is extreme fear. The put to call ratio went from signaling ‘greed’ to ‘fear.’ The difference between stock and bond returns went from ‘extreme fear’ to ‘fear.’ Most sectors were higher. The two worst sectors were consumer discretionary and consumer staples which fell 0.56% and 0.17%. The consumer discretionary sector was hurt by Ulta’s massive decline. Its stock fell 29.55% which was its worst post earnings decline in its history.
Similar to the stock market, treasuries had big intraday movements, but didn’t change much by the close. The 10 year yield increased over 3 basis points at one point in the day, but closed flat at 1.5%. The 2 year yield was up over 2 basis points, but closed down 2 basis points to 1.5%. The two bond yields are the same now. At one point, there was a 5 basis point inversion. Finally, the 30 year yield was up over 4 points at one point, but closed flat at 1.96%. It’s still near its record low.
Hurricane Dorian Is A Big Threat
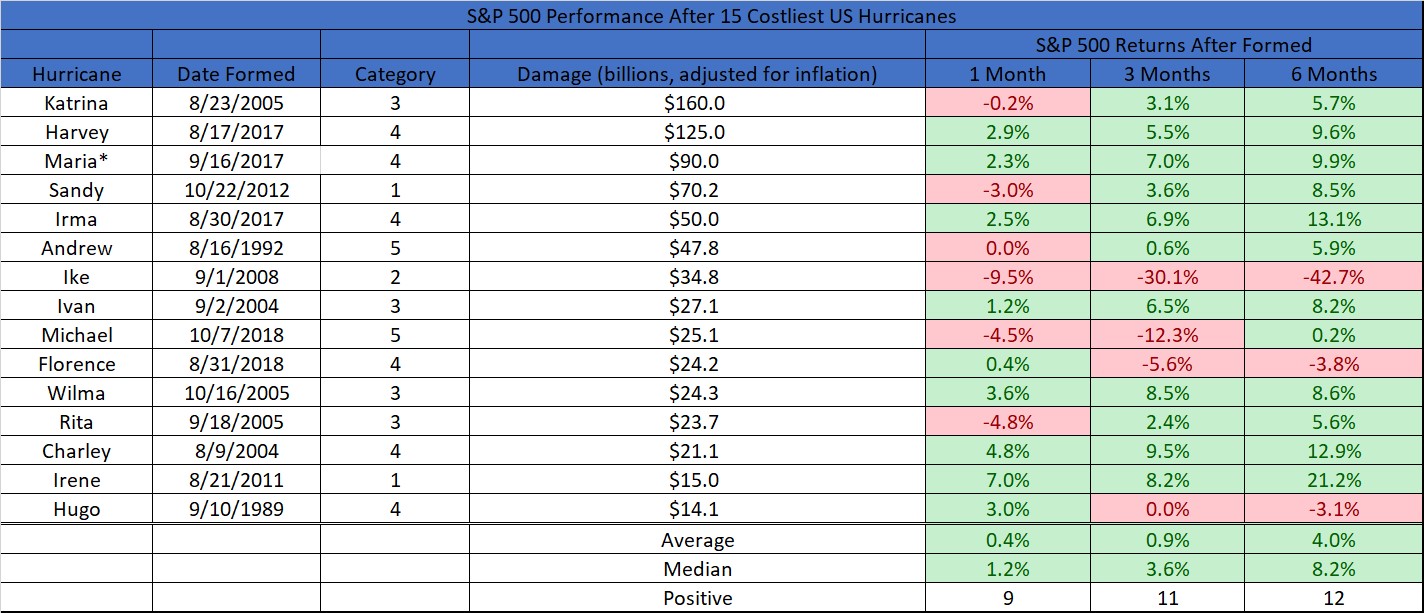
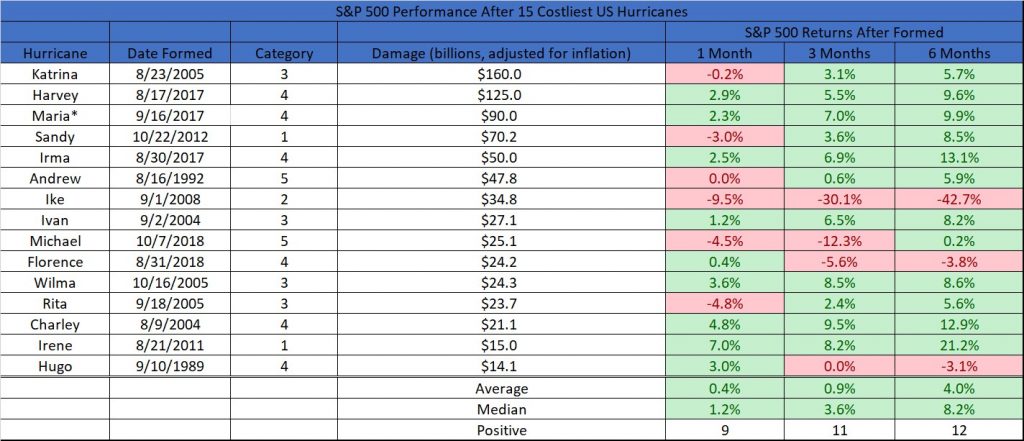
The bad news is hurricane Dorian has 140 miles per hour sustained winds. The good news is it steering north. Category 3 and 4 hurricanes that hit Florida have had damage between $11.3 billion and $37.2 billion. The table below shows the 15 costliest hurricanes and how stocks did after they formed. The median return is a fantastic 8.2% after 6 months. This storm will likely make it to the top 10 costliest. It will hurt the economy in the south which is the country’s largest housing market. However, the economy always recovers. It won’t have a big impact on 2020 growth which is what investors are mostly focused on now besides the tariffs. The trade war certainly makes traders more short sighted because rhetoric can have a major impact on the economy.
Q3 GDP Estimates
The median estimate for Q3 GDP growth is still 2%. That’s not recessionary. The economy will rely on the consumer which is why these latest tariffs can do so much damage. On Friday, the Atlanta Fed’s Nowcast lowered its estimate for Q3 GDP growth from 2.3% to just 2%. The data released on Thursday caused the estimate for real personal consumption investment growth to fall from 3.4% to 3.2% and the estimate for real non-residential equipment investment growth to fall from 4.4% to -0.5%. That would be a decline in consumption growth from the 4.7% rate in Q2.
The St. Louis Fed Nowcast raised its Q3 GDP growth estimate from 2.8% to 3%. That would be very strong growth for a slowdown. Unless growth was driven by net exports and inventories like it was in Q1, this type of reading would mean the slowdown is likely over. There was a lot of new economic data this week, but the NY Fed’s estimate only increased 4 basis points to 1.8%. As per usual, the NY Fed’s estimate is low and the St. Louis Fed’s estimate is high. Next week the Nowcast for Q4 growth will come out.
University Of Michigan Sentiment Index Falls Further
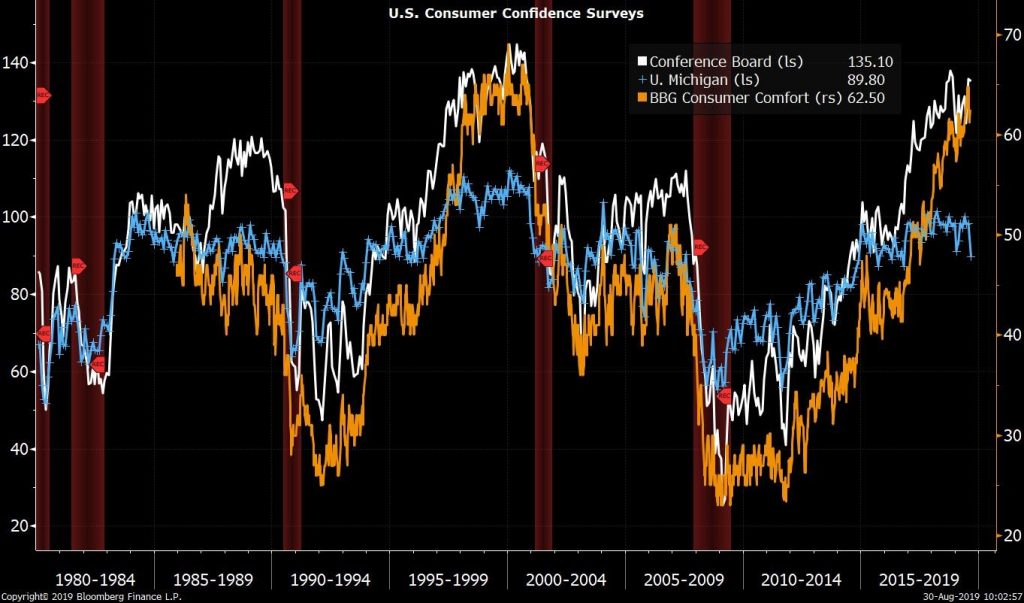
The preliminary University of Michigan consumer index showed weakness which was different from the Conference Board index. The divergence between the 2 grew in the final University of Michigan report as it came in at 89.8 which was down from the initial reading of 92.1. It missed estimates for 92.3 and the low end of the estimate range which was 92. As you can see from the chart below, it has also diverged from the Bloomberg Consumer Comfort index. The index is down 8.7% monthly and 6.7% yearly.
The current index fell modestly and the expectations index cratered. We saw expectations weaken more than the current index in the Conference Board index, but this decline was much worse. The current index fell from 110.7 to 105.3 and the expectations index fell from 90.5 to 79.9. The weakness was obviously related to the trade war and stock market volatility. The overall index had its largest monthly decline since December 2012.
The survey shows the data broken down by those who mentioned tariffs and those who didn’t. Those mentioning tariffs thought year ahead inflation would be 3.1%. Those who didn’t thought inflation would be 2.5%. 40% of those mentioning tariffs thought unemployment would rise. 26% who didn’t mention tariffs said unemployment would rise. Finally, those who mentioned tariffs saw income growth coming in at just 0.8% and those who didn’t mention them saw income growth of 2.1%.
Conclusion
The most important aspect investors should focus on is if the tariffs will hurt consumption growth in September like the University of Michigan survey showed. If the tariffs do have a major negative impact, the economy could fall into a recession despite what the GDP Nowcasts show. The good news is once the data really starts to collapse, President Trump will be motivated to make a deal.