
Richmond Fed Manufacturing Index - The Week Heading Into The First Rate Cut
Before getting into Richmond Fed Manufacturing Index - let's review the current market conditions. Stocks are heading into a historically positive period. Although, there isn’t much data to go by.
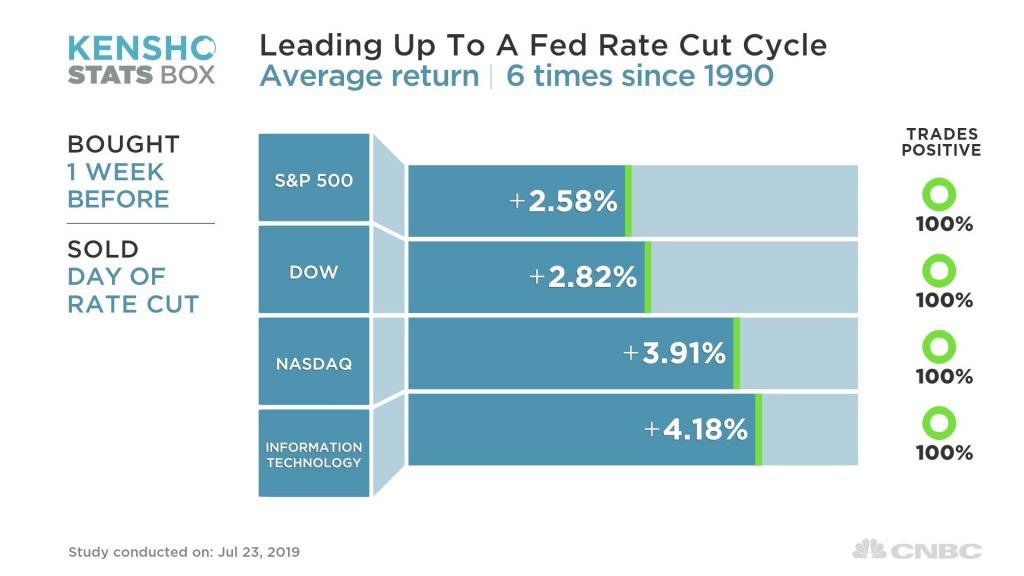
As you can see from the chart below, in the week prior to the first rate cut of the cycle, S&P 500, Dow, Nasdaq, and tech sector have been up 6 out of 6 times since 1990.
Six data points isn’t a lot. But the returns are very impressive. S&P 500 gains 2.82% and the tech sector gains 4.18% in just one week.
A big question is with forward guidance in place and the Fed funds futures market pricing in a 100% chance of a rate cut for a few weeks, why would stocks rally now?
Personally, I think stocks care more about earnings and less about the Fed meeting this week. Next week the Fed will matter because. It will give guidance through the language in its statement.
Slight Improvement In Redbook Sales Growth
Richmond Fed Manufacturing Index - Redbook same store sales growth reading in the week of July 20th improved from 4.7% to 4.9%. Even though growth improved, this report isn’t good news. It means there have been 2 weeks of below 5% growth. That's following 2 straight weeks of 6.2% growth.
That first 6.2% reading was in June which means growth in July has been weak. This is following the fantastic June retail sales report. We might see a slight downtick in yearly retail sales growth in July. That wouldn’t be a huge surprise because control group sales growth was amazing in June.
It’s tough to match such a great report. Key is to avoid a recessionary reading. A slightly weaker, but non-recessionary report could be good for stocks. It would allow the Fed to cut rates in September.
Richmond Fed Manufacturing Index - Richmond Fed’s Big Disappointment
After the solid improvement in both the Empire Fed and Philly Fed manufacturing indexes, we were led to believe the manufacturing sector was rebounding.
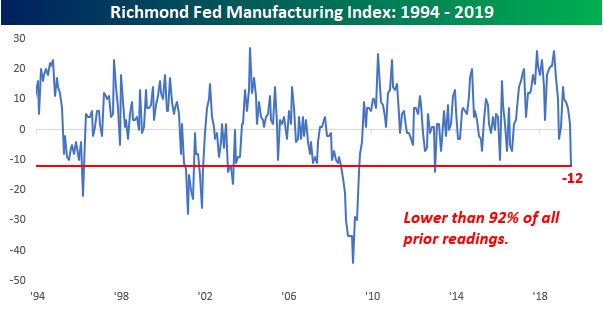
However, the July Richmond Fed index was terrible as it fell from 2 to -12. That missed estimates for 5 and the lowest estimate which was 3. This report was so bad, it makes it looks like a mistake.
However, these regional Fed reports tend to be volatile, so it’s not improbable. I won’t overreact to it though. I won’t make any decisions until the other regional Fed reports come out.
As you can see from the chart below, I’m not exaggerating by saying this seems too weak to be true. This report is worse than 92% of all prior readings.
It’s no surprise that the details of this report were terrible.
Richmond Fed Manufacturing Index - Shipments index fell from 5 to -13. Volume of new orders index fell from -2 to -18. Local business conditions index had the biggest decline as it went from 7 to -18. That was that category’s largest ever decline. Backlog of orders index fell to -26 which is the worst reading since April 2009.
The extremely weird part of this report is the expectations categories weren’t bad. There isn’t an overall index, but many of them improved. It seems like this may have been a temporary dip in the current index.
If the economy was in a recession and business was doing terribly, businesses wouldn’t expect new orders and conditions to improve. Specifically, the shipments index increased 9 points to 32. And the volume of new orders index also increased 9 points to 36.
Furthermore, the local business conditions index was up from 11 to 25. Somehow, there was a massive decline in current local business conditions. But most firms expect conditions to improve. Two weak categories in the expectations section were capex and equipment software spending which fell 9 and 10 points to 19 and 18.
Richmond Fed Manufacturing Index - Another Decline In Home Price Growth
May FHFA house price index showed growth fell again. Monthly growth was 0.1% which missed estimates for 0.3% growth and the prior reading of 0.4%.
That’s the weakest monthly growth rate since January 2017. The yearly growth rate fell from 5.3% to 5%. That’s the weakest yearly growth rate since March 2015. Housing should be becoming more affordable with the decline in interest rates and the solid average real wage growth.
Pacific region had 4.5% growth which is a sequential improvement. But, as the chart below shows, is much below last year’s yearly growth of 7.6%. Previously hot areas such as Seattle have seen a huge decline in growth.
Case Shiller index showed Seattle home price growth was 0% in its April report.
May Case Shiller index comes out next Tuesday.
It has shown lower yearly growth than the FHFA index. But I’m more concerned with comparing each indicator to itself. 5% growth in that report would be high, but for the FHFA report it’s low.
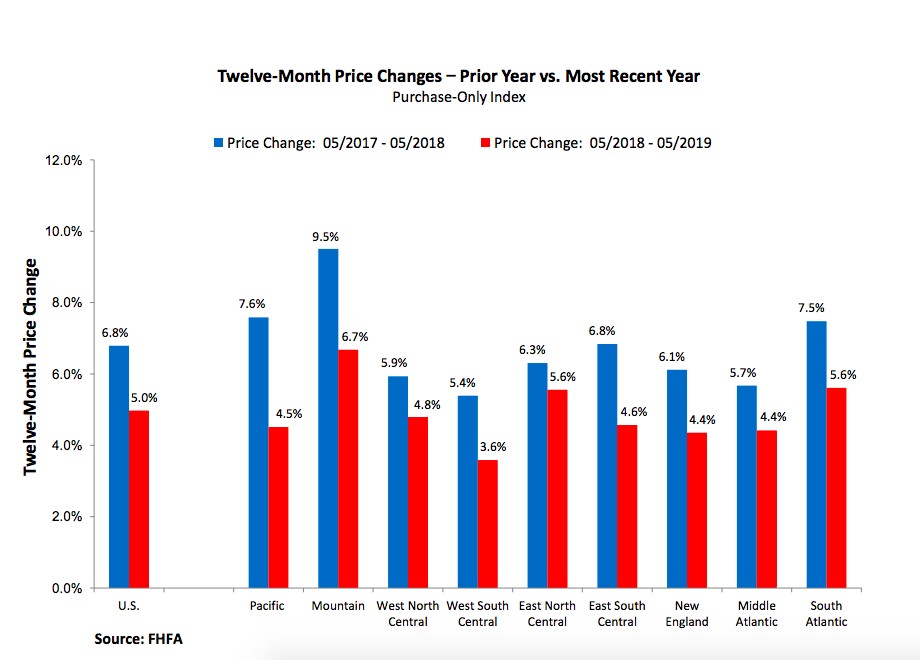
Growth in home prices in the Mountain region slowed a full point to 6.7%. As you can see, growth was 9.5% last year. The most obvious trend in this chart is the relatively high decline in the growth rates in the previously high-flying regions.
Regions that didn’t have high price growth in 2018 have only seen modest declines in growth. For example, home price growth in the Middle Atlantic region went from 5.7% last year to 4.4% this May.
Growth in Washington D.C. was low in 2018 and hasn’t fallen since then. It’s highly likely that growth declines further in Seattle than it does in Washington D.C. in the May Case Shiller report.
Richmond Fed Manufacturing Index - Conclusion
Stocks could rally sharply in the next week based on the last 6 times the Fed cut rates for the first time in the cycle. I could see stocks being up. But ultimately their performance depends on earnings, not the Fed as a cut is priced in.
Richmond Fed index was so terrible, it almost looks like a mistake. It’s not in tune with the other regional Fed indexes. FHFA home price index showed a continuation of the decline in home price growth. Case Shiller index might see close to 3% growth in May; it was 3.5% in April.