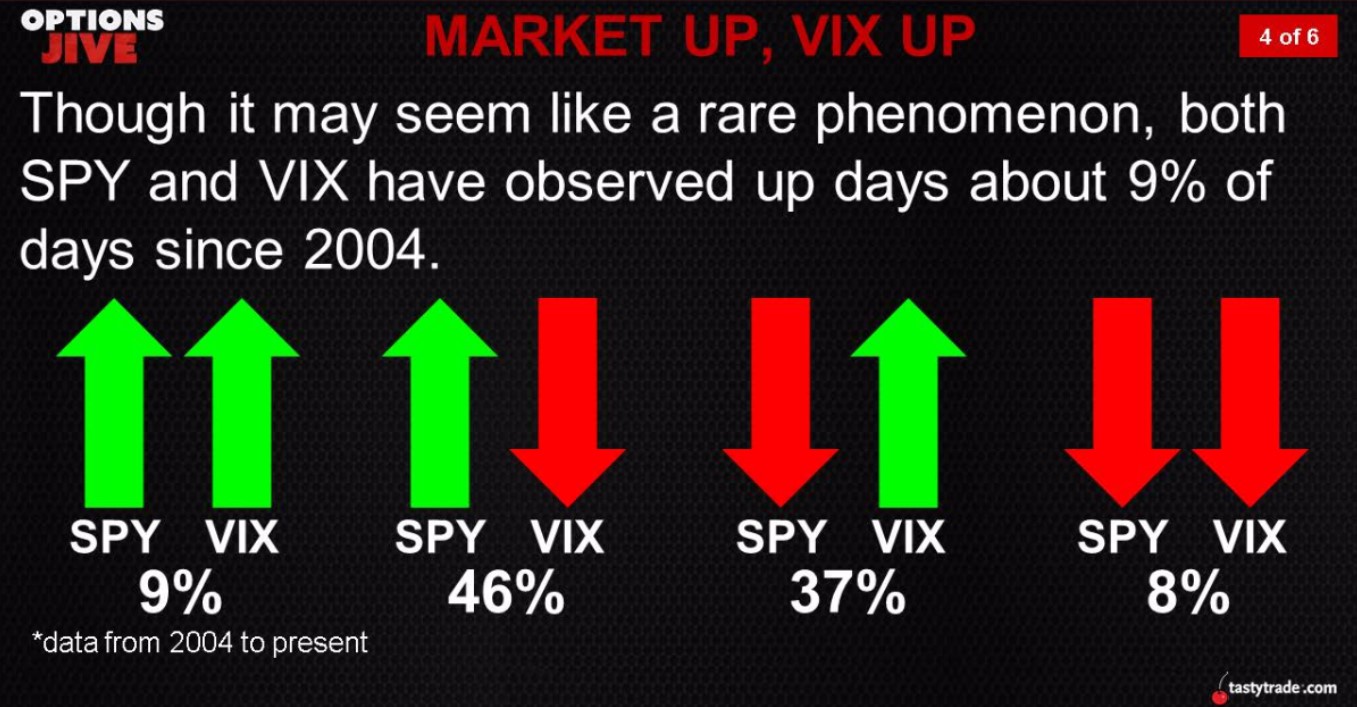
Monday’s trading was yet another example of a day where the market went up and the VIX went up. There seems to be quite a few of these occurrences happening as the market hasn’t fallen much, but the VIX occasionally catches a bid because of various potential worries such as geopolitical or monetary policy concerns. The slide below shows that the S&P 500 and the VIX have risen simultaneously about 9% of the time. Today the VIX was up 9.17% and the S&P 500 was up 0.07%
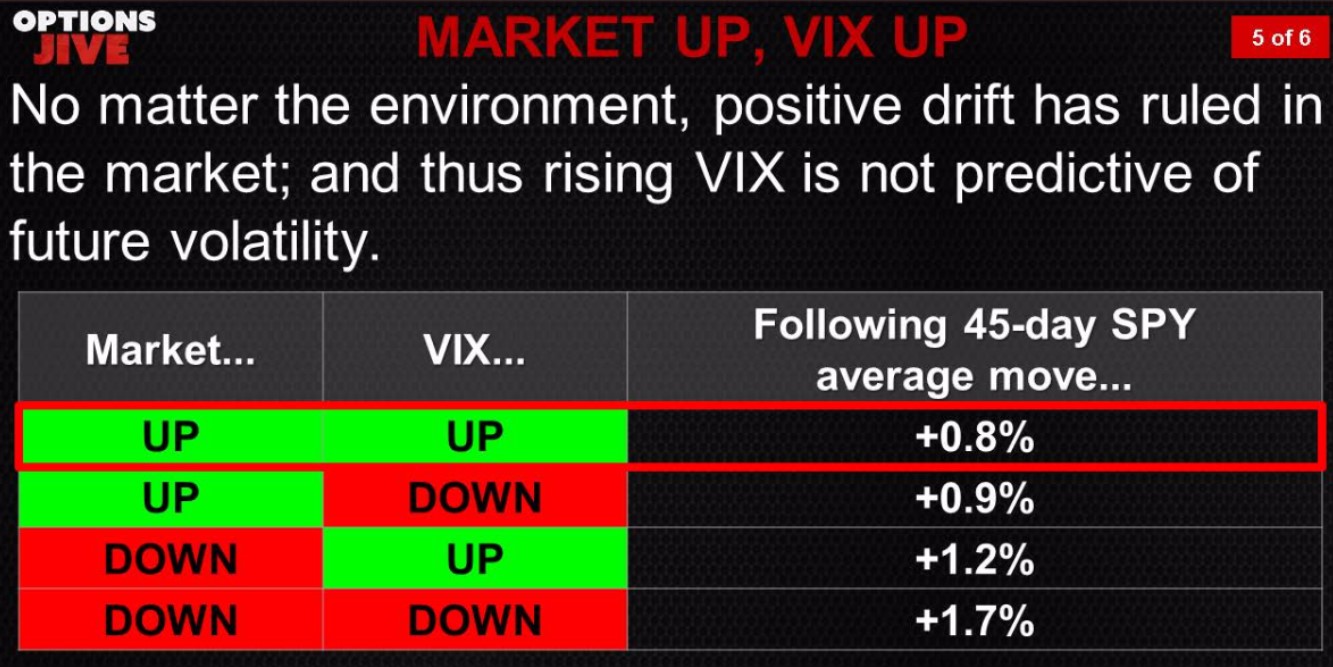
As someone who is open to the bearish thesis, you’d think I’d make the point that this is a sign of further volatility to come. However, I don’t feel the need to add hyperbole to a market with many real bearish factors in play. As you can see from the chart below, an increasing VIX doesn’t predict a falling stock market. It does have the lowest 45-day return, but it’s still positive like it is for the other three scenarios.
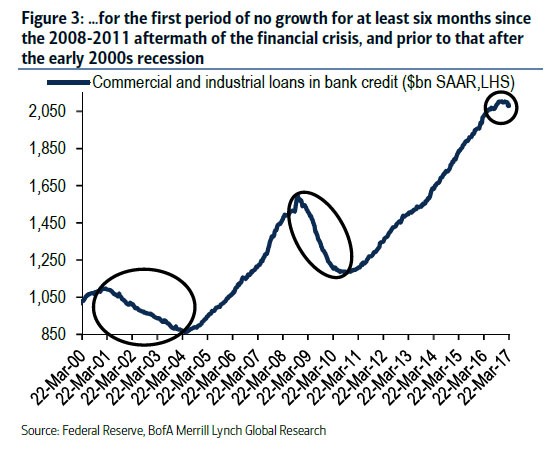
As I was mentioning in my previous article, there isn’t much evidence to support Morgan Stanley’s claim that the cycle has twelve months of gains left. As you can see in the chart below, C&I lending is starting to deteriorate like it did in 2008 and 2001. If the stock market is supposed to perform like it did in 1999 and 2007, shouldn’t the C&I lending growth be on its last gasp higher instead of starting to fall? With that being said, I don’t expect the C&I lending to take a sharp downturn lower until we see some weakness in the labor market outside of one month which was influenced by a winter storm. There aren’t any indicators which are falling sharply which would signal the recession has started. There are simply warning signs like the one below combined with the old age of the business cycle which signal a clear yellow caution flag.
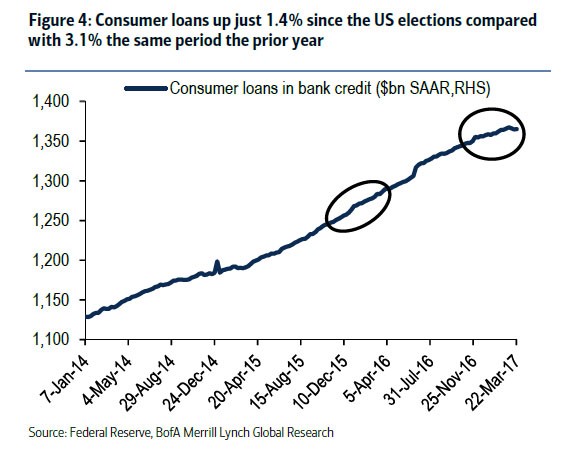
As you can see from chart below, consumer bank credit is starting to decelerate as the growth rate is below half last year’s rate. The consumer data is like most aspects of the economy; it is showing mixed results. The sentiment indicator is high, but it looks like the Q1 GDP report will show below 1% retail sales growth. It’s possible that mixed results could signal we’re near a recession. However, this entire recovery has been one of fits and starts meaning the economy may only be in a mini-soft patch. Usually a recovery has a mid-cycle slowdowns. This recovery has had multiple slowdowns because it has been long and weak.
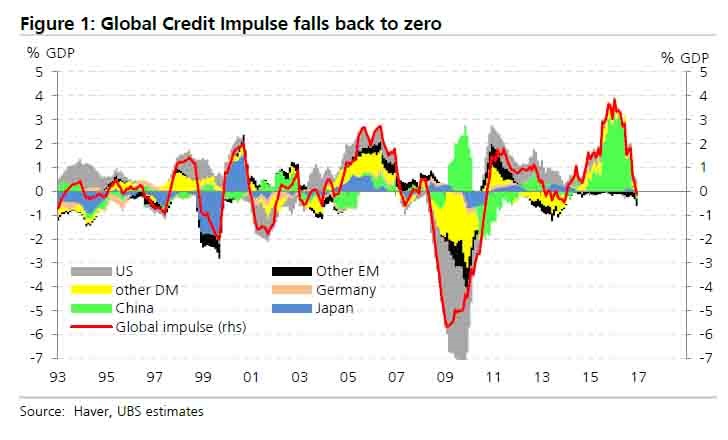
You can see the clearly defined single mid-cycle slowdown in the chart below which shows global credit growth. China is no longer driving the credit cycle which means it may be over. Given the low productivity growth and low labor force growth in the developed world, credit growth is more important than ever before. If interest rates were to rise, the credit bubble would pop, but because real growth is so low, interest rates stay low. That is the same ‘rock and hard place’ situation the economy has been in for years.
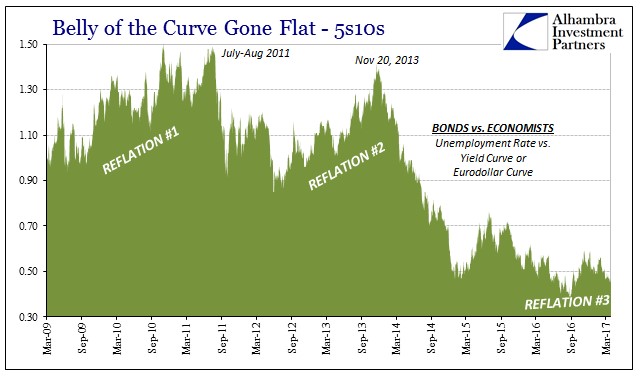
The periods where economists and investors have thought the economy may finally get out of the ‘rock and hard place’ are named the reflation trades. Real growth doesn’t always correlate with inflation, but when demand for commodities grows inflation tends to increase. The chart below shows the difference between the ten-year note and the five-year note. It is used to highlight the reflation trades which never grew to become trends. It shows what I mentioned earlier which is that there have been a few fits and starts in this recovery with multiple slowdowns. The second reflation trade ended when oil prices collapsed. However, you can’t claim oil prices falling was an exogenous event. The reason why oil fell is because of increased U.S. nonconventional oil drilling, but the reason for the increase of drilling is credit growth.
Without low interest rates, the fracking surge would not have been that large. Low interest rates are a key reason why U.S. production rebounded so quickly after the price of oil started to recover. Many say the innovation in U.S. drilling is responsible for the rebound in production because breakeven costs have fallen. However, it’s not mentioned enough that if interest rates rose, the breakeven costs would spike. Interest rates spiking would be the only way for OPEC to regain the market share it lost. OPEC members are great chess players, but I don’t think they’d be able to pull off raising junk bond interest rates to regain market share. The only way junk bonds rates would increase would be if the economy fell into a recession. Lower demand for oil would accompany this. In this case, OPEC would be hurt by lower oil demand and helped by crimped American production. American frackers would feel worse pain than they felt in 2015 as oil prices would fall because of shrinking demand and interest rates would rise as the risk premium on junk bonds would increase.
The final reflation trade in the bottom corner is putrid. It shows how the bond market is pricing in very little growth even though economists look at the unemployment rate and claim that the economy is strong. The unemployment rate showed itself to be useless in the last labor market report as it ticked two tenths of a point lower without any change in the labor force participation rate and with a disappointing headline number. I’d trust the bond market over the unemployment rate even though it is manipulated by the Fed’s QE program.
Conclusion
The rising VIX does not signal an impending crash in stocks. It is weird to see the VIX skyrocket on a green tape, but there’s so many real bearish indicators, there’s no reason to grasp at straws. The most obvious one is the slowdown in consumer lean growth and the decline in C&I lending. The belly of the yield curve claims the Trump reflation trade was kabuki theater. I agree with the bond market as little fiscal action has taken place