Strong Core Capital Goods Orders
August durable goods orders report had very tough comparisons, but still had positive monthly growth which is a plus. New orders were up 0.4% which followed 11.7% growth which was revised up by 0.5%. That missed the consensus of 1.5%.
Ex-transportation order growth was 0.4% as well which missed estimates for 1.2% growth. Prior reading was revised up by 0.8% to 3.2%. Core capital goods orders were up 1.8% which beat estimates for 1.7%. That’s even though the July reading was revised up from 1.9% to 2.5%.
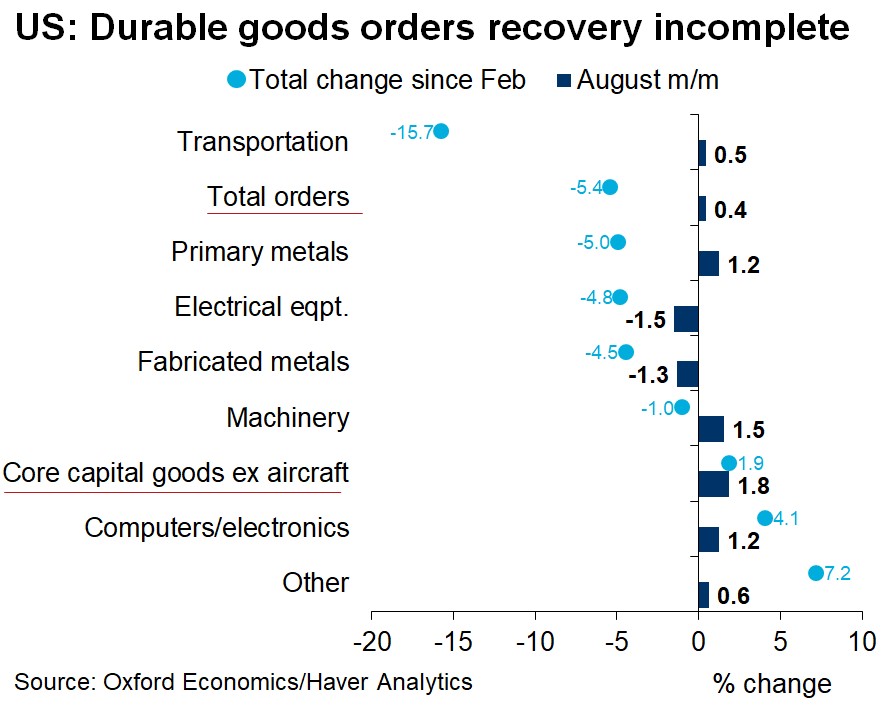
The chart above tells us what we already knew. Parts of the economy have more than fully recovered, while other parts haven’t recovered close to what they lost in the recession. Predictably, orders for computers and electronics are up 4.1% since February. That category had 1.2% monthly growth, signaling it isn’t slowing down yet. It will likely see a cyclical slowdown within the next few months when treatments/vaccines come out.
Interestingly, unlike other cyclical improvements, some speculators actually believe this trend will exist forever because of the digitalization of the economy. There’s no question the economy will be more digital 5 years from now. However, the growth rates will slow dramatically in the next few quarters as the economy reopens, there is more competition, and comps are tougher.
On the other side, transportation orders are still down 15.7% since February, causing overall orders to be down 5.4%. Core capital goods orders excluding aircrafts are up 1.9% because this category doesn’t include the negative effect of COVID-19 limiting flying.
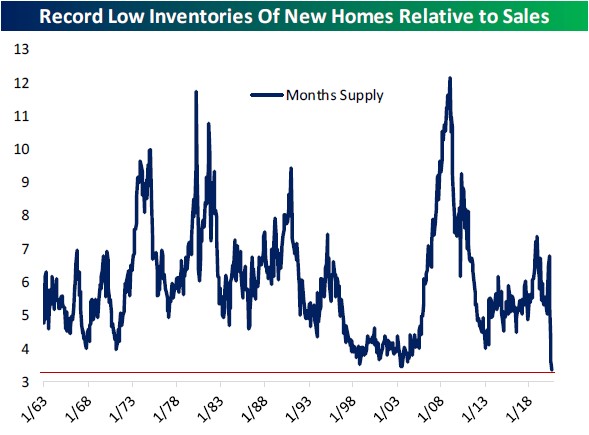
Very Strong New Home Sales
August new home sales report was incredibly strong. As you can see from the chart below, sales were 1.011 million which was the highest since late 2006 right before the housing bubble burst. It's amazing that we simultaneously have the strongest housing market since the housing bubble and the strongest tech market since the 1990s tech bubble. Some are now bearish on both home improvement stocks and work from home stocks.

Others are not extremely bearish on the housing market though. It's unlikely that there will be another burst like from 2007 to 2010 because buyers have higher credit scores and haven’t take out adjustable rate mortgages with teaser rates. Monthly growth by region was very mixed as it was 13.4% in the south, 5% in the northeast, -1.7% in the west, and -21.4% in the Midwest.
Home sales are the highest in the west and south. Obviously, the wildfires hurt the housing market in the west. It should be even worse in September. Then, there might be a boom as destroyed houses will need to be replaced. Since August 15th, wildfires have destroyed 6,900 structures.
An interesting part of this housing report is that new home inventories versus sales hit a record low. As you can see from the chart below, there were only 3.3 months of new home inventories at the current sales rate. We have some people moving away from cities combined with low interest rates and high household net worth. This amazing combination won’t continue indefinitely. There could be some modest price weakness once new supply comes online if COVID-19 goes away and interest rates rise mildly.
No Disaster In Retail?
The chart below probably will shock some people. As you can see, retail bankruptcies are very low compared to the financial crisis. This goes against the narrative that no one will shop in stores again. Retailers were probably helped by a few factors. Firstly, the bad retailers are already mostly gone because sales have been shifting online for years.
Secondly, the Fed helped companies avoid disaster. Thirdly, there was a huge burst in spending because of the stimulus. Goods sales beat services sales because of COVID-19, which played into the hands of retailers. We found out by the end of the spring that shopping in stores is fairly safe in relation to eating at a restaurant or flying on a plane.

Investors Love Junk Bonds
If you were surprised by the movement towards junk bonds in the last expansion, you will be shocked beyond belief by this year’s action. We have a combination of support by the Fed, euphoric risk taking, and a search for yield. 10 year bond yield fell 1.2 basis points to 65.8 on Friday which kept it in its 6 month range.
This yield has barely moved since the volatility related to the COVID-19 crisis went away. High is 90.2 basis points and the low end of the range is 50.8 basis points. We can be highly confident this will break out to the upside rather than the downside, but timing is uncertain. It could take a couple weeks or a year.
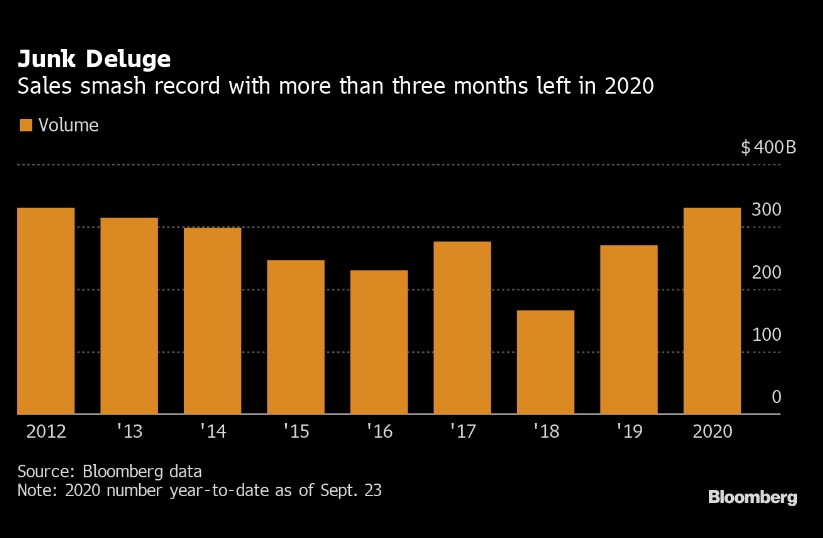
As you can see from the chart above, the decline in yields, risk taking, and support from the Fed have pushed junk bond issuance to $329.8 billion this year which is a record high. It already beat out the amount raised in 2012 (the entire year).
When you combine the money raised via junk bonds with the money raised via IPOs and SPACs, this year is set to be one for the ages in terms of risk taking. We already knew once the virus hit that this would be a historic year, but we didn’t know how sharply we’d see a reversal from fear to greed.
Conclusion
Durable new orders report was ok. Industries hit the hardest by COVID-19 are still in trouble. Question remains when the risk of the virus becomes minimized to the point where people will travel and work in offices again. Housing market is the hottest since the 2000s bubble. There haven’t been that many retail bankruptcies this year.
We’ve seen record SPACs, money raised via IPOs, and junk bond debt issued. This has been a year for the ages. We should strongly question how long this will continue. That’s because some are calling for the 10 year yield to rise above 1% once we get a stimulus and positive news on a COVID-19 treatment or vaccine.