4 Day Losing Streak?
Shockingly, the S&P 500 is on a 4 day losing streak. It fell 44 basis points on Monday. We say ‘shockingly’ because the other indexes have done well and the S&P 500’s declines have been so small (it’s barely noticeable). There is still about the same amount of euphoria in markets as there was before this 4 day losing streak.
Sure, Airbnb and Snowflake have fallen hard recently, but small caps and tech have done well. Airbnb fell 6.6% on Monday, putting it down 10.2% in its 2 days of trading. Snowflake was down 7% on Monday, putting it down 15.6% in the past 4 days. The S&P 500 is only down 1.5% in this 4 day losing streak.
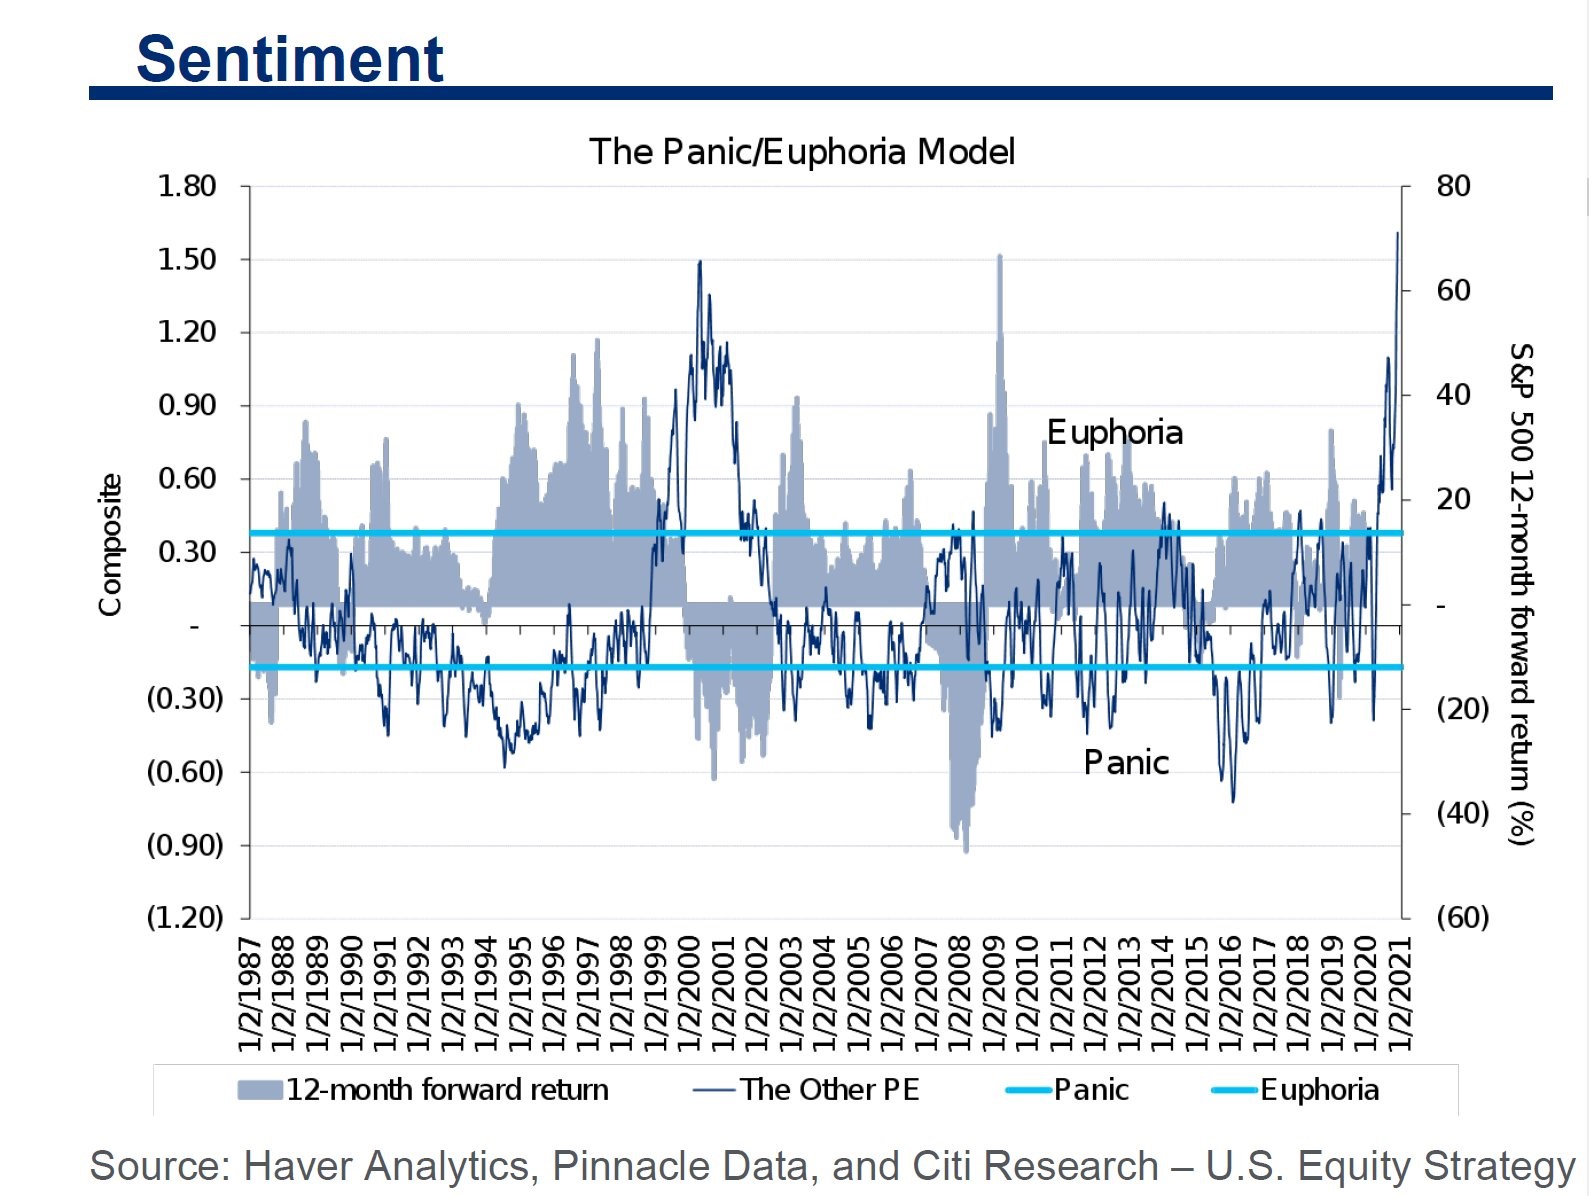
The stock market is still overbought despite the mini streak. As you can see from the chart above, the panic euphoria index shows record euphoria. It’s above the peak in early 2000. That spells bad news for 12 month returns. Everyone points to valuations and euphoria being bad for long term returns, but even 1 year subsequent results look bad at these levels.
The S&P 500 is trading at 28.8 times earnings. It peaked at slightly above 30 in the tech bubble. This market is a combination of 2010 and 2000 which are both peaks in the PE ratio. It’s like 2010 because we are coming out of a recession and it’s like early 2000 because there is a lot of speculation.
Since we have a lot of optimism and low earnings, it wouldn’t be surprising if the PE ratio gets above the peak of 30. That will happen if the market keeps rising in early 2021. Earnings will rebound sharply in the cyclical sectors in the 2nd half of 2021.
Expensive Small Caps?
The Russell 2000 is up 94.9% since the bottom in March. This is the fastest almost double ever. The 2nd fastest was 10 days slower in 1982. In the 3 months after the small cap index has almost doubled, the returns ranged from -7.8% to 1.2%. A 7.8% decline actually wouldn’t be that bad. It’s up 24.5% since October 30th as it finally broke out from its August 2018 high.
Despite taking over 2 years to reach a new record, some are already calling it expensive. The small cap PE ratio is about 80% of the large cap PE ratio which is the lowest since the early 2000s. The trough after the tech bubble peak was 60%. That’s because many of the tech stocks that did well, did so well that they became large caps without the profits to match.
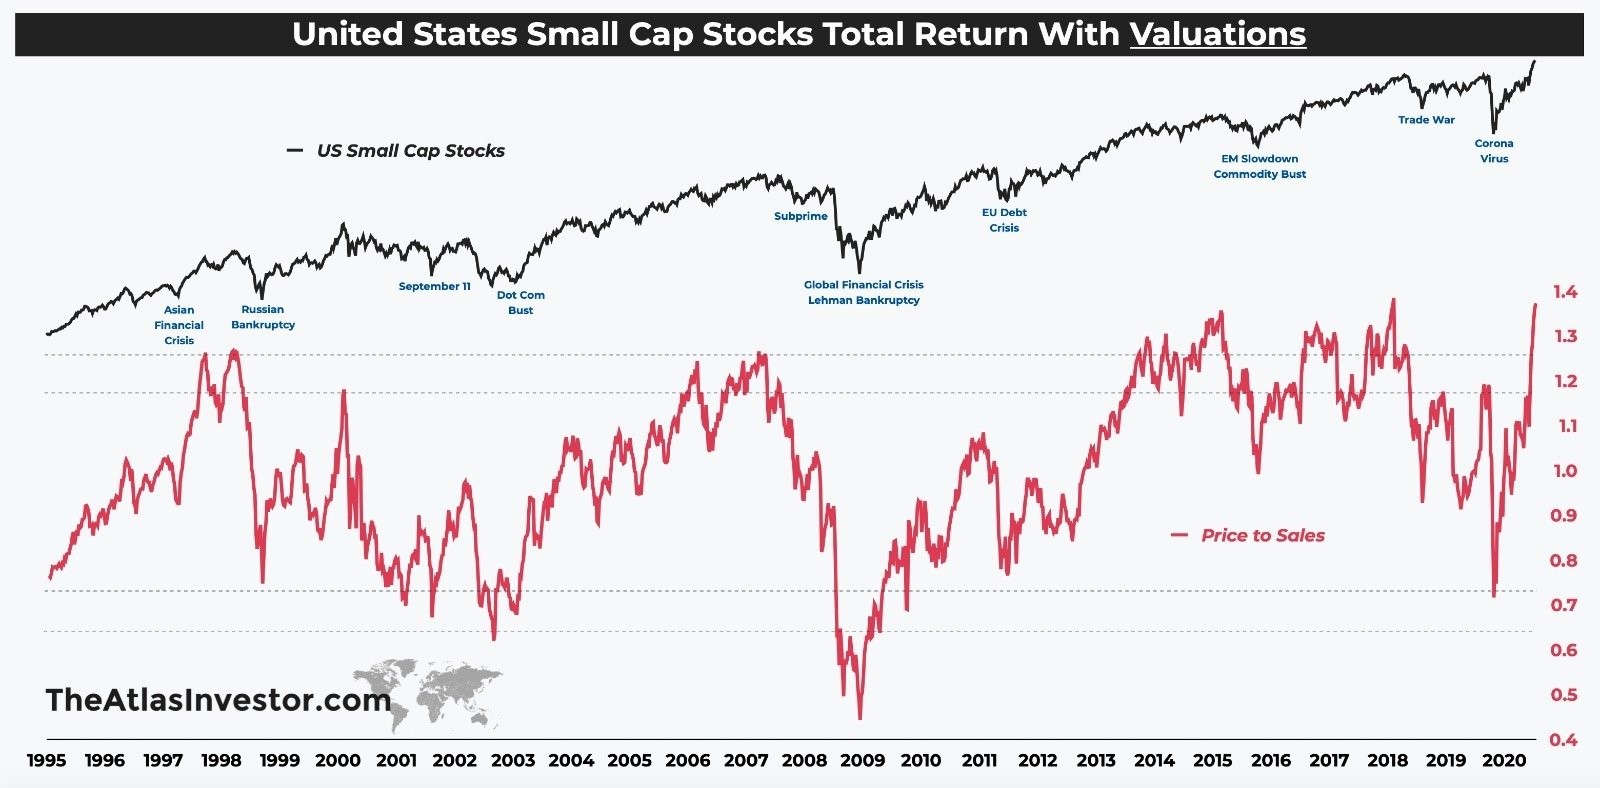
On the other hand, the S&P 500 has a record price to sales ratio. Its PE ratio is near its 2000 top. Being cheaper than something that is expensive doesn’t make the small cap index a buy. As you can see from the chart above, the small cap index has near a record high price to sales ratio.
The index is 9.9% above its record high in August, so that makes sense. Some investors are bearish on small cap growth and bullish on small cap value. The small cap growth index is 25.5% above its August 2018 peak, while the small cap value index is 6.5% below its record.
Bubble Trouble
If you want to find bubble stocks, look at what’s in Ark Invest’s portfolios. These portfolios invest in disruptive innovation. Ark Invest has become popular because of how well its stocks have done. Its buying has caused these stocks to move higher because of the money the funds have gotten. It’s a virtuous cycle that will go in reverse when the bubble ends.
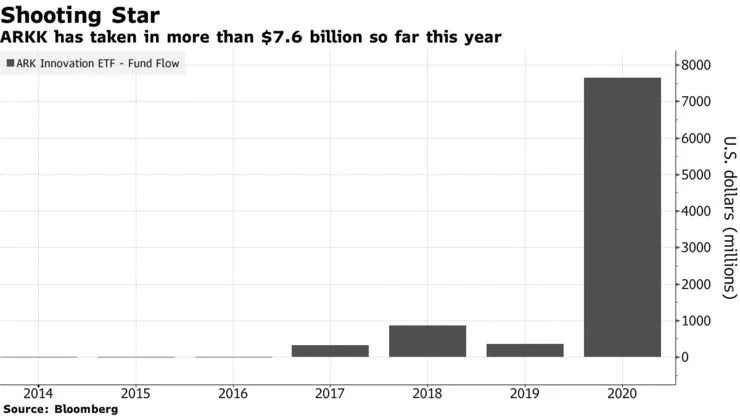
As you can see in the chart below, ARKK has taken in $7.6 billion this year. If growth stocks have a good 2021, ARKK can easily take in more. The problem is a lot of these firms are issuing shares, so eventually the tires fall off the car. Nio stock has been crashing since it issued shares. It is down 26% from its record and 9.4% in the past 2 days.
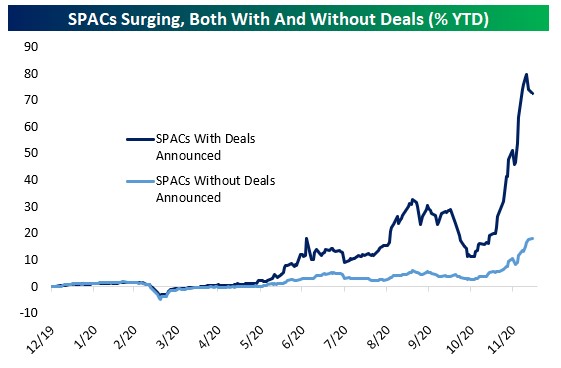
SPACs are the easiest bubbles to spot. Many of these firms don’t even have sales yet. These stocks most resemble the dot com bubble. As you can see from the chart below, SPACs that haven’t even announced deals yet are up 20% this year which is better than the S&P 500.
That means a company that just says it will buy something is doing better than actual businesses. By the way, whatever the SPAC buys will likely be terrible because every good private company has already been bought. Robinhood is not going to do a SPAC. It will IPO early next year.
Nasdaq And Russell 2000 Rise
Other indexes aren’t on a 4 day losing streak. The Nasdaq was up 50 basis points and the Russell 2000 was up 11 basis points on Monday. Oil stocks fell the most as the energy sector fell 3.5%. It was dragged down by ExxonMobil which fell 3.6%. Tesla helped push the Nasdaq 100 higher as it was up 73 basis points and Tesla rose 4.89%. Tesla is 1.55% below its record.
Investors are excited to see if Tesla keeps rallying because this is stock market history in the making. This bubble will be discussed in the history books 20 years from now. This is the moment of truth as Tesla will be added to the S&P 500 on Monday which means the index buying will happen this week. Tesla will be added to the consumer discretionary sector which it will dominate with Amazon.
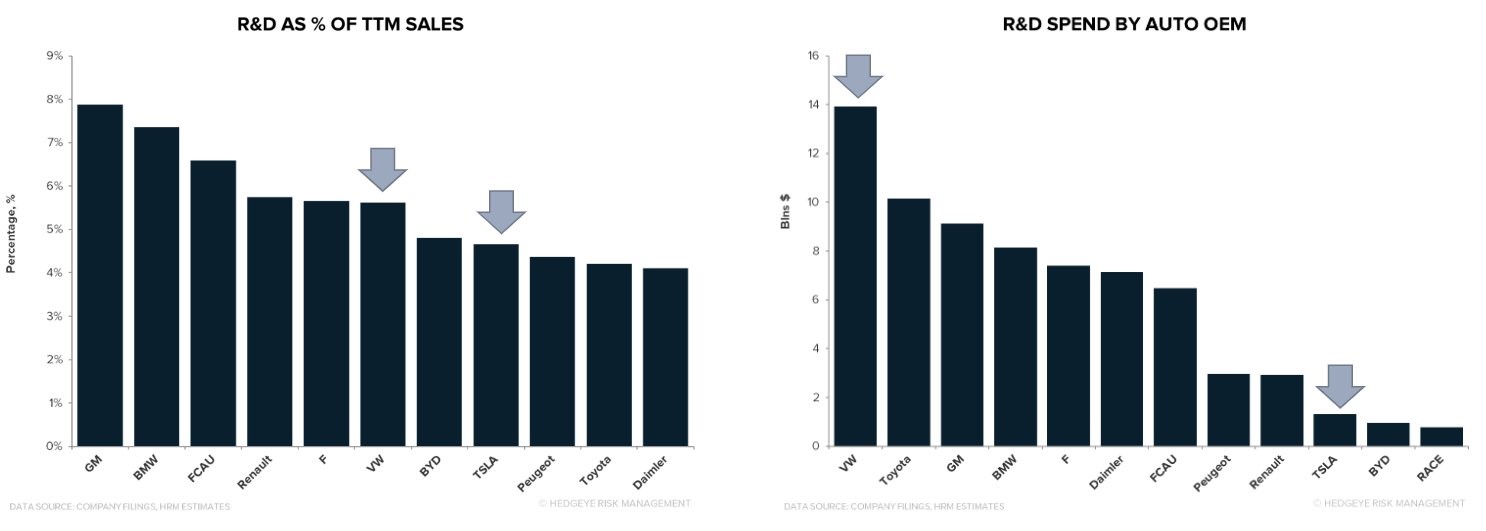
Index investors are about to be left holding the bag. They didn’t benefit from Tesla’s rise this year and they will get hurt by its decline next year. As you can see from the chart on the left, even though Tesla is considered an innovator, it only comes in 8th when it comes to research and development as a percentage of sales.
Because its sales are so small, on a nominal basis, it comes in 10th in R&D spending. Volkswagen is spending much more on R&D and is taking share from Tesla in Europe’s EV market.