Redbook Sales Growth Improves Again
My theory is growth is slowing in the areas most impacted by COVID-19. This includes many states in the south and the west. With the northeast and the Midwest improving, it’s interesting to see what that does to national data. Redbook same store sales growth in the week of June 27th improved from -6.1% to -5.7%. Any improvement is good as it inches closer to the flatline. I can’t tell how COVID-19 impacted these results. You would think growth would have been higher if cases fell throughout the country.
Real Time Data Stops Improving
Homebase calculates the 7 day moving average of hourly employees working. This shows growth is slowing in California, Florida, Texas, North Carolina, Arizona, and South Carolina. That’s a massive chunk of the country. That’s all the biggest states. States with continued improvement were Connecticut, New Jersey, and Rhode Island.
Arizona recently announced it is joining Texas, Florida, and parts of California in delaying its reopening. The chart below shows real time economic activity according to Jefferies has stopped improving. That’s bad because it’s 40% below where it was in early March.
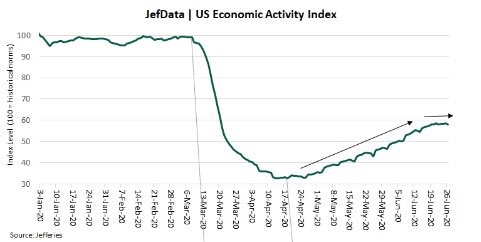
Obviously, the economy can’t afford to stop improving because activity is still far below normal. This stalling might impact July’s results more than June’s results. If during earnings season, firms start mentioning how the recovery hasn’t continued, stocks could plummet. This would be the opposite of Q1 earnings season when firms discussed how much growth improved in April. That was a positive even though on an absolute basis growth was dreadful.
COVID-19 Update
In terms of cases, everyday America flirts with a new high. Good news is the 3 day moving average seems to have stopped spiking. On June 26th, the 3 day average of national cases was 43,712 and on June 30th the average was 43,772. It wouldn’t be surprising if we are near the end of the spike in cases in the hotspots and nationally because of the increased precautions. It’s very simple. If people wash their hands, don’t gather in groups, and wear a mask, the cases count will fall.
Hope is that these measures are done for a long enough time to clamp down on the virus. It worked in the northeast and in Europe. There needs to be a few weeks of declines in the south and the west before politicians think about reopening. People in New York are still wearing masks even though case counts are low because they don’t want it to come back.
7 day average of national deaths went from 627 on June 22nd to 581 on June 30th. We can expect this to spike near 750 by mid-July because of the spike in cases. If that occurs, investors might not care because by then new cases per day will likely be falling.
A scary part of this latest spike is Texas is expanding its elective surgery ban which means people who need things such as a hip replacement can’t get one for at least a few weeks. Even if Texas wasn’t banning these surgeries, plenty of people would be scared to go to the hospital out of fear of catching COVID-19.
This latest spike is likely near its end. On Tuesday, the 3 day moving average of new cases in Florida fell below the 7 day average for the first time since June 23rd. That’s because on Monday and Tuesday, cases were much lower than they were in the prior 3 days.
Arizona is looking better as well as there were only 2,228 cases on Tuesday which was the lowest since June 24th. That's not to say we will see a steep decline in early July, just that the spike might be over.
Solid Improvement In Consumer Confidence
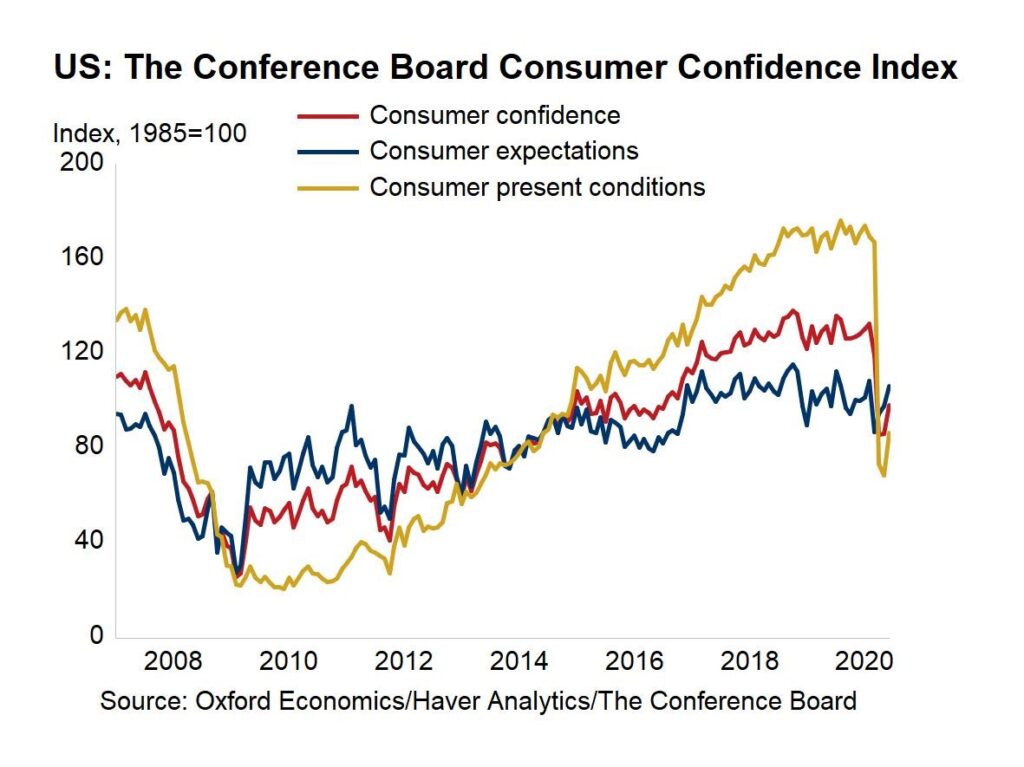
Just like the University of Michigan survey, the Conference Board survey showed consumer confidence improved in June. As you can see from the chart below, the index jumped from 85.9 to 98.1 which dramatically beat estimates for 90. It’s good to see economists’ estimates still being beat.
That will likely change in July as the rate of economic improvement slows and expectations rise. Improvement in the June reading was driven by both categories. Expectations index rose from 97.6 to 106 and the present conditions index rose from 68.4 to 86.2 which is a relatively dramatic increase. Confidence never fell to the levels of the last recession even though the unemployment rate spiked higher.
Percentage of consumers saying current business conditions are good rose 1 point to 17.4%. Those saying conditions are bad for business fell 8 points to 43.2%. Those saying jobs are plentiful rose from 16.5% to 20.8% and those saying jobs are hard to get fell from 29.2% to 23.8%. This reading almost got to a net positive which implies there was strong job creation in June. We will see on Thursday.
Consumers expecting business conditions to improve in the next 6 months stayed at 42.6% and those expecting conditions to worsen fell from 20.5% to 15.3%. Those expecting more jobs actually fell from 39.5% to 38.4%. On the positive side, those expecting fewer jobs fell from 19.9% to 14.2%.
Percentage of consumers expecting higher income in the short term rose slightly to 15.1% and those expecting less income fell slightly to 14.4%. This pushed the net number to the positives. Reality is that income is largely impacted by fiscal stimulus, not the labor market.
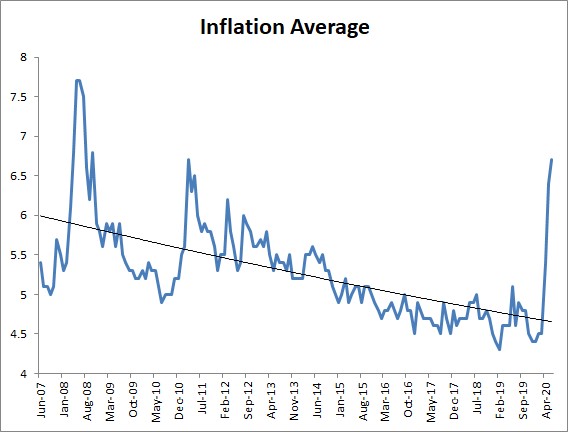
As you can see from the chart above, inflation expectations spiked to 6.7% which is a 9 year high. This is shocking because inflation is barely positive. We don’t expect these expectations to stay this high. Obviously, if inflation spiked that high, it would be a disaster for stocks and the economy.
We would have stagflation. One of the reasons inflation has been so low in the past few years is because expectations are well anchored. This chart doesn’t look well anchored, but obviously it’s only one survey, so I wouldn’t recommend altering your portfolio because of it.