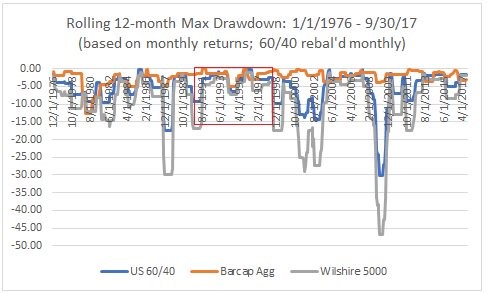
Drawdowns Of 10% Are Rare In Stocks & Bonds
Even though the major indexes were all down on Monday, the S&P 500 still broke the record for the longest streak without a 3% correction. In searching for a volatility metric that the current streak hasn’t breached, I found the chart below. It shows the maximum monthly drawdowns for the Barclays aggregate bond fund, a U.S. portfolio of 60% stocks and 40% bonds, and the Wilshire 5000. To be clear, the Barclays bond fund has 42.5% government bonds and 25.8% corporate bonds. The Wilshire 5000 includes virtually every stock in America. The chart shows that the longest streak without a 10% downturn in any of these assets/portfolios since 1976 is the 95 month period from September 1990 to July 1998. The current streak is 73 months starting in September 2011. Therefore, we’re less than 2 years away from reaching this feat. It shows how volatility in both stocks and bonds has barely existed for a long stretch. Bonds have hardly ever had a 10% correction in this chart because bonds have been in a bull market since the early 1980s.
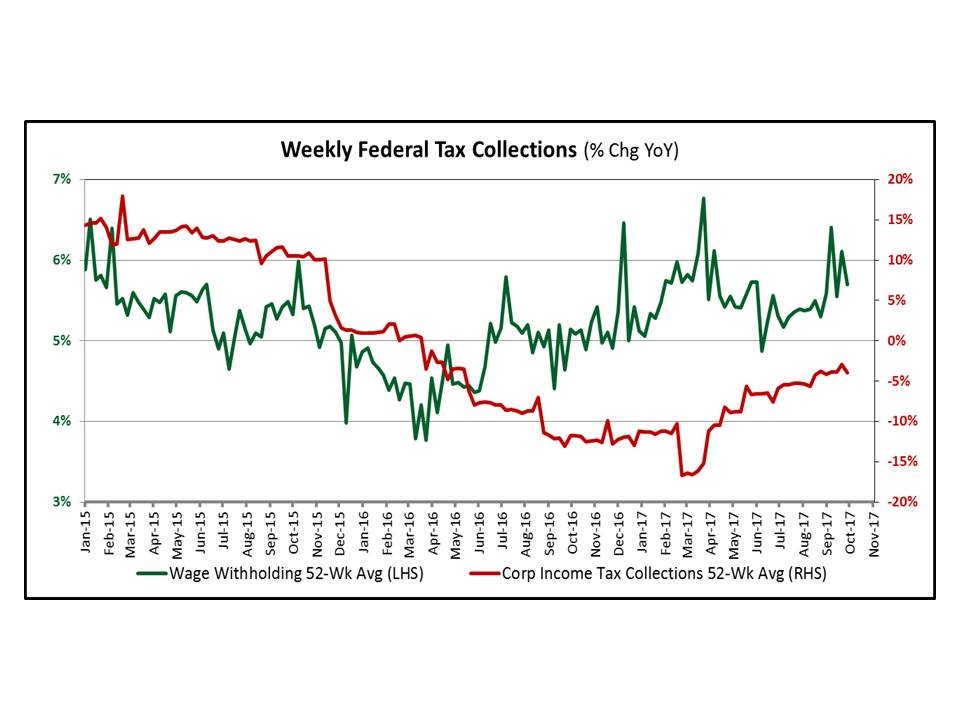
Tax Collections Are Improving
To get a reading on the strength of the economy, one of the best indicators is tax collections. The chart below shows the wage withholdings and the corporate tax collections. As you can see, personal income tax withholdings have recovered from the weakness in 2015. Corporations finally started recovering in early 2017, but they’re still in decline. That’s because this is a 52 week average and because corporations can deduct losses from their tax bill. The losses from energy firms started to be used up in 2017 and technology profits have accelerated. Some of the insurance companies who had a high number of claims because of hurricanes Harvey and Irma will use losses to limit their tax bill in 2018. With this in mind, both are trending in the right direction. This shows the economy is strengthening as the labor market and corporate profits are healthy.
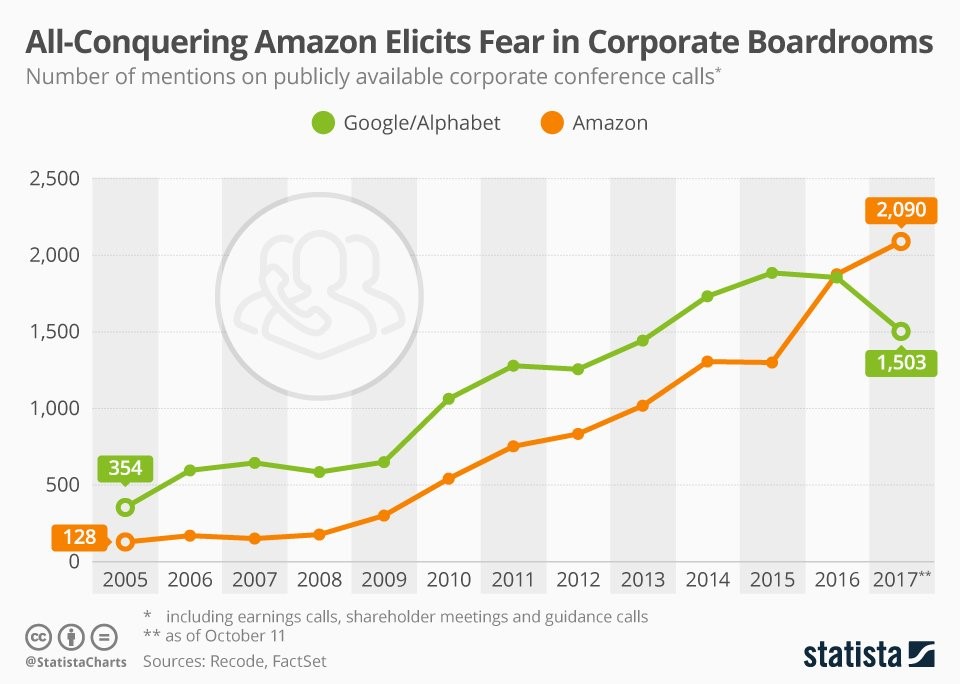
Everyone Is Watching Amazon - AMZN & Alphabet
When reviewing this current period in market history, I often mention how the top 5 companies don’t have a higher percentage of the total stock market cap than usual. However, the top tech firms generate a large amount of the business in the industries they operate in. Therefore, the monopolies they have garnered mean the biggest risk to their businesses appears to be regulatory. This risk packs a strong punch in Europe where heavy fines have already been levied for anti-competitive practices. The chart below shows how often Alphabet and Amazon have been mentioned in conference calls. It’s reasonable to assert that their investments into other businesses are attempts to avoid regulatory risk. By focusing extra resources in new businesses, they make it look like they aren’t trying to strangle the competition. Amazon does this more which is probably why it was mentioned more in conference calls in 2017. That has a downside as Amazon is barely profitable. This is caused by its investments into new businesses and because selling goods online has low margins.
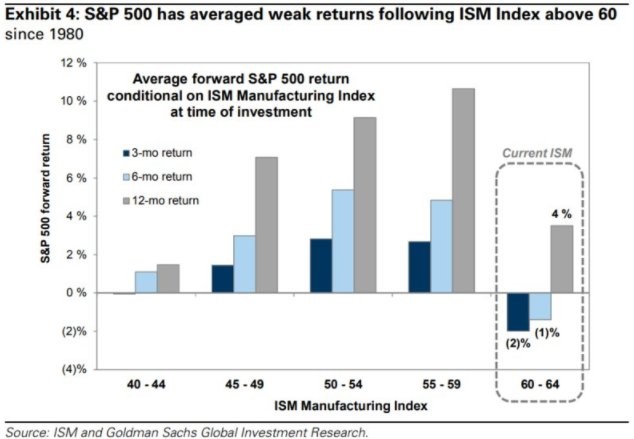
Good News Is Bad News
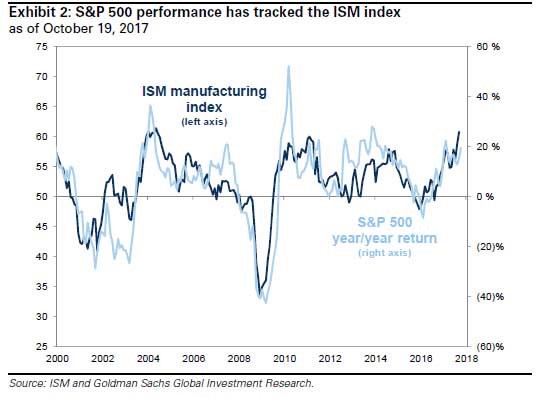
Because of the Fed reacting to economic reports, we’ve seen stocks rally when bad news comes out and sell off when good news comes out. This trend isn’t as strong now as it was in years past because the Fed is on a solid trajectory of raising rates and lowering the balance sheet. However, in the past this trend has existed in a different form. For example, when consumer confidence gets too high, it can be a contrarian indicator. This appears to be the case with the ISM manufacturing index as seen in the chart below. The chart shows the S&P 500’s performance after the ISM hits 60 which is a great result. As you can see, returns in the 3 month and 6 month periods after the ISM hits 60-64 are worse than ISM reports between 40 and 44 which indicate the economy is in a recession. The current ISM is at 60.8. So far, stocks have rallied since it was released a couple weeks ago.
The chart below shows this data in a different manner. As you can see, the S&P 500 has tracked the ISM manufacturing report’s performance. This shows that if you can predict where the next report will be, you have a good idea where stocks will be. Given the fact that the other economic reports show momentum, I wouldn’t be surprised to see the ISM report maintain its strength, albeit at slightly lower levels.
Global Earnings Recovery
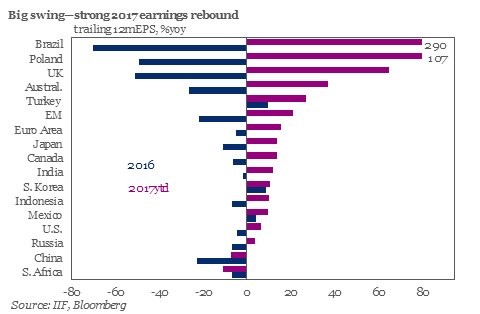
In the past few months, one of the biggest stories about the market has been the earnings recovery. It revolves around the price of oil increasing and the manufacturing economy recovering. There has also been a rebound in global trade showing the fears of protectionism were wrong. As you can see in the chart below, the big earnings shift in America looks like nothing when you compare it to other nations. As you can see, Brazil has had a sharp turnaround ever since it came out of its depression. Emerging markets as a whole have had a big shift from negative to positive. The fact that America’s shift was so small compared to the other countries is the exact reason why it gets a higher multiple than emerging markets. America has a solid political system, liquid capital markets, and a resilient consumer all of which make its companies earnings more valuable than companies which are based abroad.
Conclusion
I’m not expecting a drawdown in stocks because the ISM report is great. We haven’t had any weakness all year. I’d expect the catalyst for a selloff to be a big surprise in economic data or political news. It’s tough to forecast what could make the market fall because clearly the usual rules don’t apply. Low volatility begets low volatility. It’s seemingly impossible to determine what will make the market act normal again. I’d say a big uptick in inflation is the main risk for stocks in the next year.