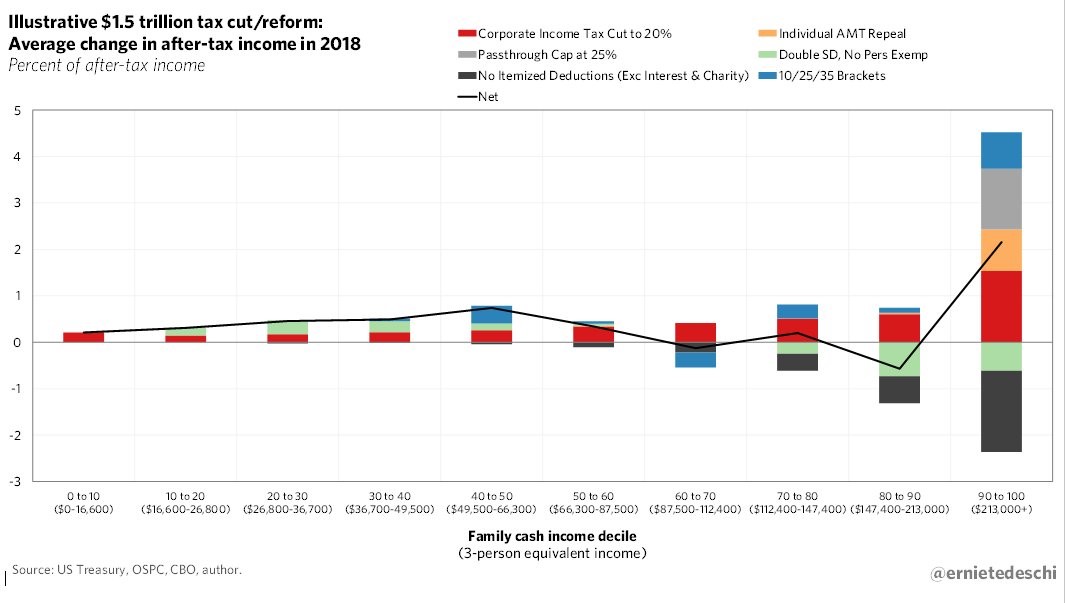
It appears the healthcare debate is over for the time being. The conversation will now move towards tax reform in the next few weeks. The chart below is a great representation of how each reform measure would affect people in various income groups. Each color represents one of the 6 reform measures being discussed. Of course, these are only guesses of what the change will be. For example, the corporate income tax might be changed to 15% or 25%. As you can see, most families will benefit from the changes. The biggest beneficiary is the top decile and the decile which will be hit the most is the 80th to 90th percentile. The rich pay the most taxes, so any tax cut is going to help them the most. However, it is interesting that this isn’t an upward curve. The changes designed to hurt the rich hurt the upper middle class to the point where it’s a net negative, while the richest 10% are helped. You can use this chart to help decide stocks to invest in. Companies whose customers are in the upper middle class might be ones to avoid, while those who serve the middle-middle class and the rich could be ideas you want to invest in.
Speaking of deciding which companies to invest in, let’s look at the earnings update. I’ve discussed many times how the Q3 earnings estimates have been falling for the past few weeks. Interestingly, even though estimates have been falling, the guidance has been great. 75 firms have issued negative guidance and 43 have issued positive guidance. That may sound terrible, but it’s actually better than average. The five year average is for 79 companies to issue negative EPS guidance and 27 companies to issue positive EPS guidance. Companies are afraid to disappoint investors. Investors get mad about earnings misses and start complaining if firms don’t tell them immediately when issues are occurring with the business.
The chart below shows the timing of the guidance issuances for Q3 for S&P 500 companies. As you can see, almost all companies have issued guidance before August 25th. The main reason for this is because of seasonality. Usually S&P 500 companies don’t issue guidance in September as we get closer to the reporting date. If a company really wants to give an update to the business, it can pre-announce earnings rather than give guidance. The reason this chart was created was to see the effect the hurricanes had on guidance. Some companies probably held off on discussing results because it’s uncertain how the natural disasters affected sales. 6 companies issued guidance since the storms. 3 mentioned the storms, but 2 of them said it’s too early to tell the full impact.
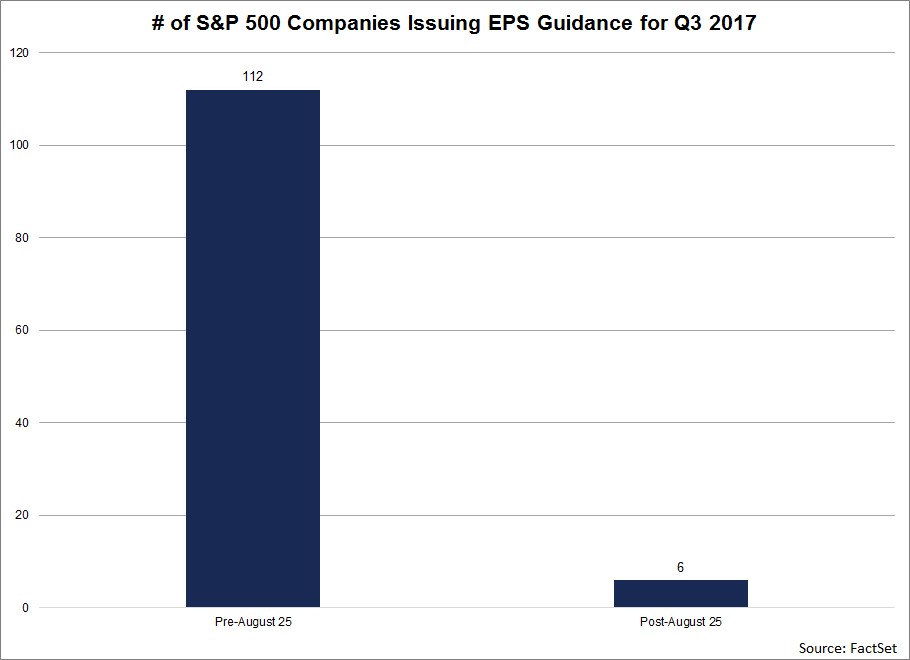
In summary, some companies may have held off guidance because of the storms. More importantly, we don’t know the effects because the storms occurred during a period where results usually aren’t discussed. The storms might be why analysts are lowering expectations. They are currently in the dark because they don’t have much reports to go by. This means we might see an unusual divergence between actual reports and what estimates are showing. It’s tough to determine if that’s a good or bad sign. At the start of earnings season some companies might report numbers which differ widely from results. Eventually investors should realize the giant one time event which happened twice and is affecting any companies with a southern presence. Any company which misses guidance because of storm related weakness will get a pass from traders.
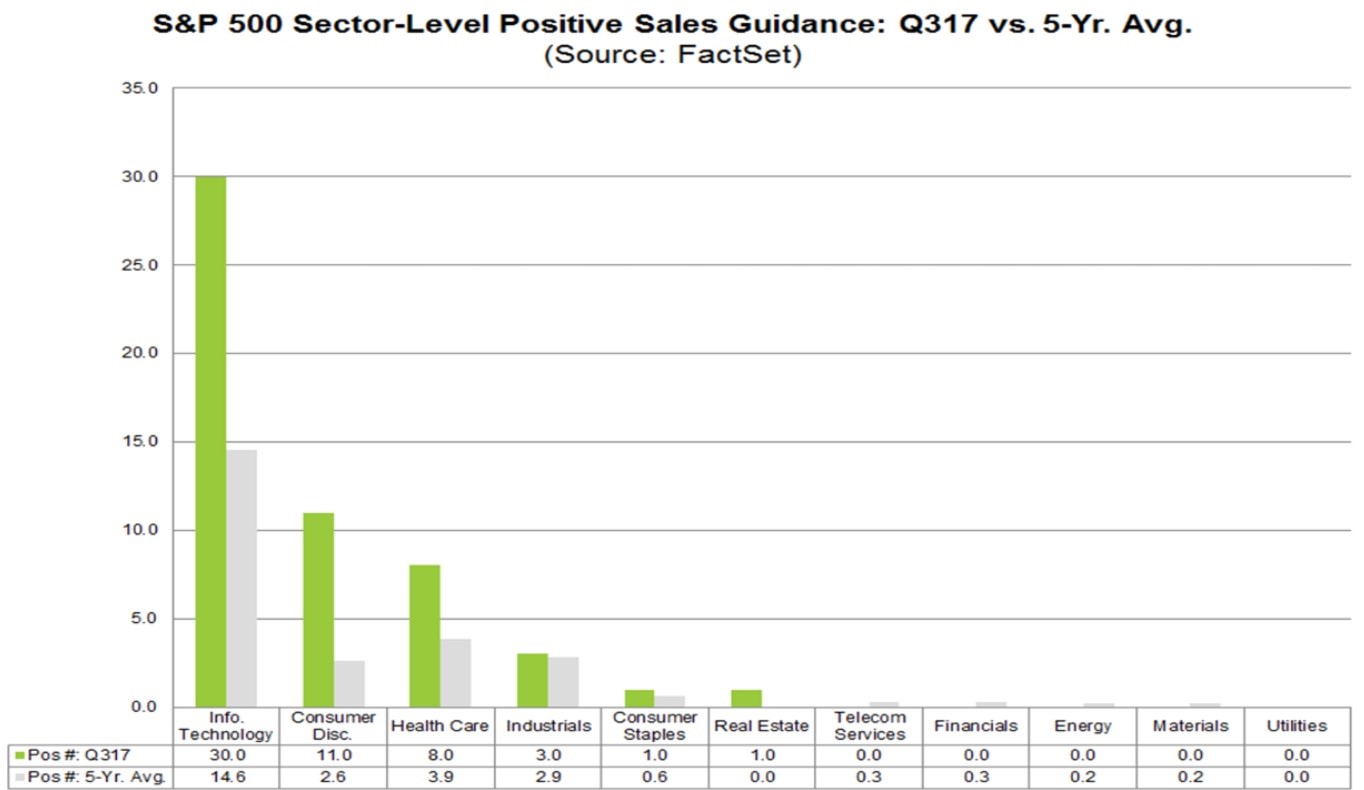
As was mentioned, there were 43 companies that issued positive earnings guidance. This positivity was driven by sales as 54 companies issued positive sales guidance. That’s the highest result since at least 2006. The chart below breaks down the sectors that are seeing positive sales trends. As you can see, technology, consumer discretionary, and healthcare are leading the charge higher. There’s a big tailwind from the weak dollar which is helping results. Cooper Companies was quoted as saying the following: “From an FX perspective, that's a little bit of a different story. We had about $0.16 benefit from FX this quarter. And when we look at Q4, we have about a $0.12 FX benefit. So, some nice benefit coming from currency in Q3 and Q4.”
The chart below is the one I’ve been discussing for weeks. The bottom up earnings for Q3 has been declining sharply for a few weeks. Now earnings are only expected to grow 4.2% year over year. When the results come out we’ll determine if this weakness is solely related to the hurricanes or if there’s something else which is bringing estimates lower. It’s weird to see earnings growing double digits in the first half and the next 3 quarters after Q3, while Q3 is expected to grow so slowly. My guess is that earnings growth will surprise to the upside because guidance was great. Unless there’s a specific point I’m not seeing, I think earnings will beat more than average because of the strong global economy and weak dollar.
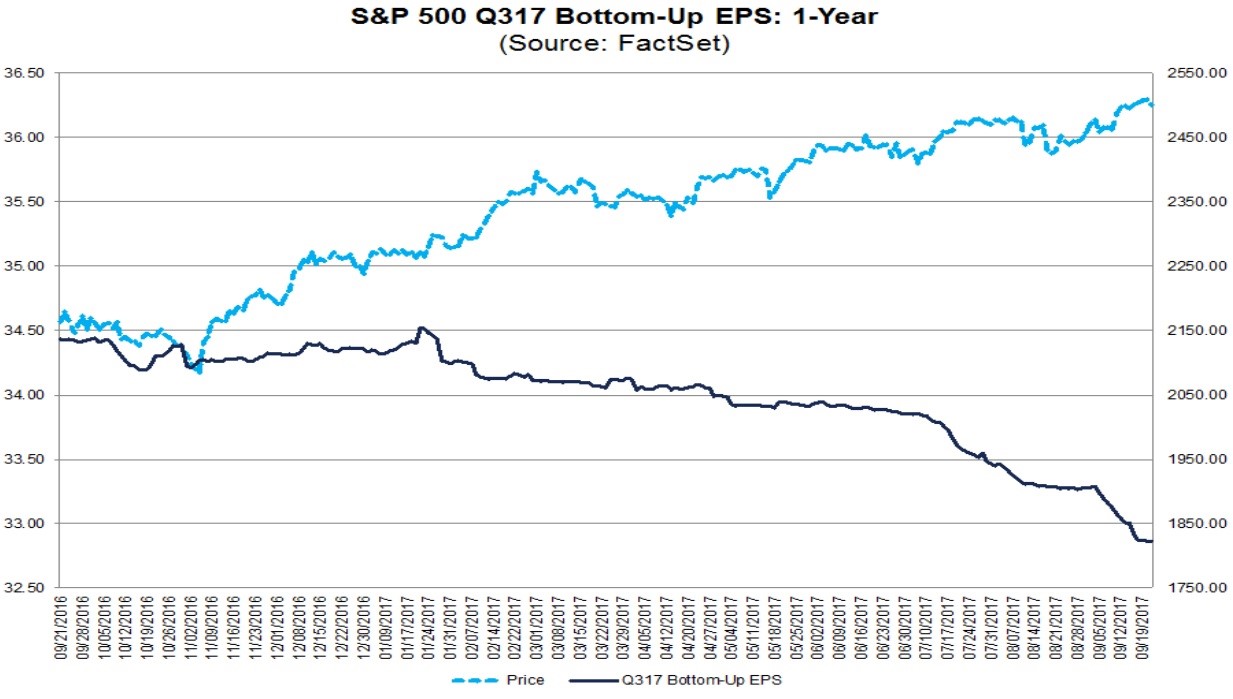
If the temporary decline in earnings is actually temporary, then this won’t affect stocks and I’ll be barking up the wrong tree. However, until we get a full explanation as to why the weakness is temporary, we won’t be able to determine if the weakness will continue into Q4. The bottom up estimates for Q4 are meaningless because it’s so far out in advance. As I said, I’m expecting Q3 to be a good quarter if the only weakness is caused by the hurricane. If there’s a new trend I’m missing, earnings will disappoint.
Conclusion
The chart on the effects of tax changes can be used as a guide for your investing. The chances of anything being passed by the end of the year are declining everyday no progress is made. You can multiply the effects by the probability of anything getting passed to get an expected outcome. Obviously, if you don’t think there’s much of a chance anything gets done, then you don’t need to use the chart.