On Thursday, instead of rallying, the S&P 500 fell 0.86% and the Nasdaq fell 1.44%. The S&P financials sector was up 0.65% and the technology sector was down 1.83%. The selloff was blamed on investors rebalancing their portfolios since it is the penultimate day of the quarter. In a normal market, this wouldn’t even be considered a selloff, but in this market, any time the S&P 500 moves more than 0.5% it’s a big deal.
The biggest economic report on Thursday was the Q1 GDP revision. It was initially published at 0.7%. After two revisions, the final estimate for Q1 GDP is 1.4%. The report was revised higher due to upward revisions to personal consumption expenditures and exports. As you can see in the chart below, annualized personal consumption was up 1.1% which is greater than the 0.6% growth reported in the first revision to GDP. The downward revision to fixed investment pulled the final report slightly lower.
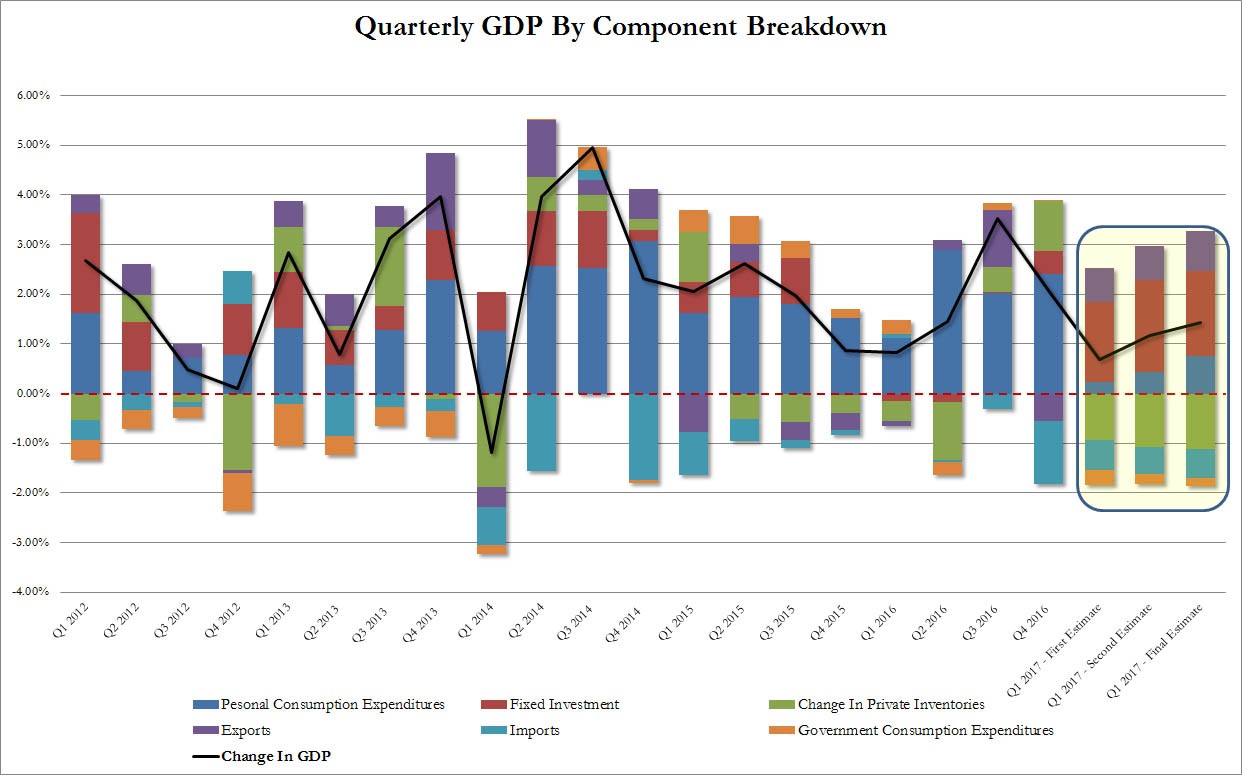
This revision is consistent with the point I made about GDP reports after this one came out. I said advanced estimates are only a guess. This makes forecasts for what the advanced GDP report will be a guess on a guess about where the economy is. Every report needs to be taken with a grain of salt. When the final report comes out investors have long forgotten about that quarter. Investors are focused on the second half of 2017, making the report seem useless. It’s not useless. This report is in tune with the theme that Q2 won’t be a bounce back quarter. Q2 won’t be as great as initially thought and Q1 was better than what was first reported. Q2 GDP growth may only be marginally better than Q1.
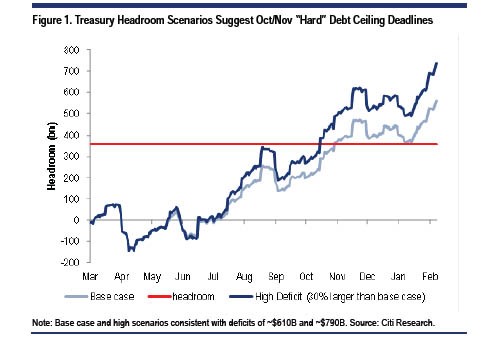
The chart below shows Citi’s estimate for when the debt ceiling will be breached. As you can see, it will begin to become an issue in October if nothing gets done. I have been expecting this to become an issue in September. This extra month is great news as it gives Congress more time to raise it. The struggle will be to get the healthcare legislation passed before then, so there’s momentum to get a deal done to raise the ceiling. The two forces coming to a head are the ideological differences among Republicans in the Senate and the motivation to not want to look bad as its likely that problems with the debt ceiling will be blamed on Republicans. There is pressure to compromise to get a deal done, but if it’s a bad deal, election risks exist.
Along with GDP, the government’s corporate profits report was released. I’ve reviewed the difference between corporate profits which is calculated in a top down fashion by the government and bottom up calculations done by S&P/Down Jones. The difference was on display in the latest report which showed corporate profits falling at an annual rate of 2.7% in Q1. This doesn’t mean investors will start selling soon. The Q1 earnings reports were great. The government findings are something to watch out for as the divergence can’t continue. However, this won’t break the bull case for stocks.
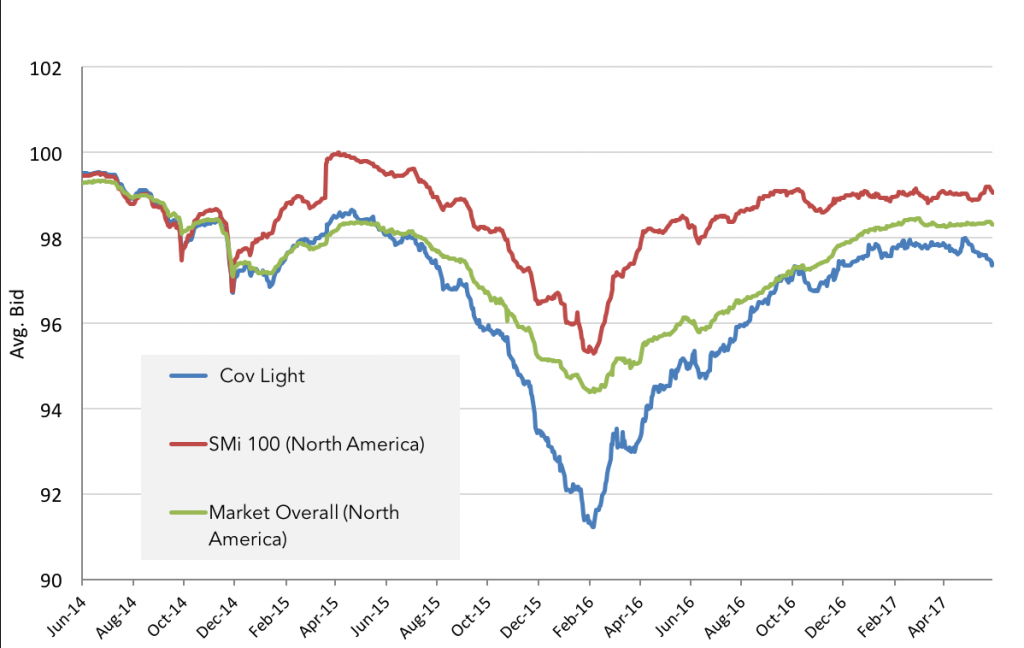
I have expressed my worry about covenant lite loans in the past few months because they have become such a large part of the debt market despite their risky nature. This is the first time they have gotten to be a large part of the market, meaning this cycle will be the first to see the ramifications of lending money without limitations to corporations. Everything looks fine until the firm sees problems. Because of the potential problems these loans can have, I consider the pricing of these loans to be a leading indicator for the economy. As you can see from the chart below, the covenant lite loans saw problems in 2015 because of the commodity crash. As you can see at the end, recently these loans have seen their average bid declining. This could be a sign that the debt market might be going from calm to stressed again.
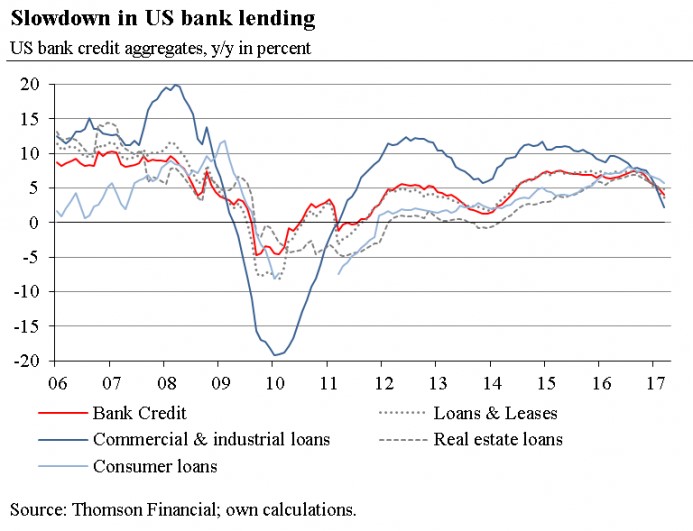
If I were to name one indicator which makes me worried about a recession in 2017, it would be the bank lending stats. As you can see, year over year lending in loans & leases, real estate loans, consumer loans, bank credit, and commercial & industrial loans are all seeing their growth deteriorate. This is likely an issue with comparisons as there was a rebound in 2015 and 2016. It’s interesting to see how this chart is nothing like the financial conditions index. The financial conditions were weak in 2015, yet lending growth was accelerating. Now lending growth is weak, yet the financial conditions are as great as they can be. In recessions, the credit indicators all become aligned like we’re seeing with the weakness in covenant lite bids and lending growth. If the lending growth comes down further in Q3, it could cause stress in the system, making conditions tighten.
Another scenario which worries me is the issue of reflexivity. That is when a stock selloff causes the economy to weaken instead of the usual reverse scenario. With stocks at such high valuations, a crash would be an unforeseen factor which can knock the economy into a recession. It’s impossible to tell when valuations will matter. Absent these catalysts, there’s nothing that signals a recession in the second half.
Conclusion
On a down day for stocks, it’s easy to wonder if this is the end of the rally. I have shown some of the potential pitfalls for the market, namely the debt ceiling being hit in October, the weakness in covenant lite bids, and the weakness in lending. That being said, with the better than expected Q1 GDP revision, the first half is looking more likely than ever to hit the Fed’s target of 1.9% long term growth, in the first half of this year.