The stock market was down slightly on Tuesday. Snap stock was down 11% to a 21 handle. While Snap doesn’t have a large market cap, it’s significant because it represents the latest excess of Wall Street. The company has a lock on the attention of teenagers and 20-somethings, but is burning cash quickly. It will fall below the IPO price at some point because cash flows matter, even though they didn’t matter in the first day of trading. It’s tough for me to assign reasons for the stock market’s fall because it’s down less than 1.5% from the peak on Wednesday. However, when I describe bearish factors, I can simply say the market still hasn’t priced them in fully.
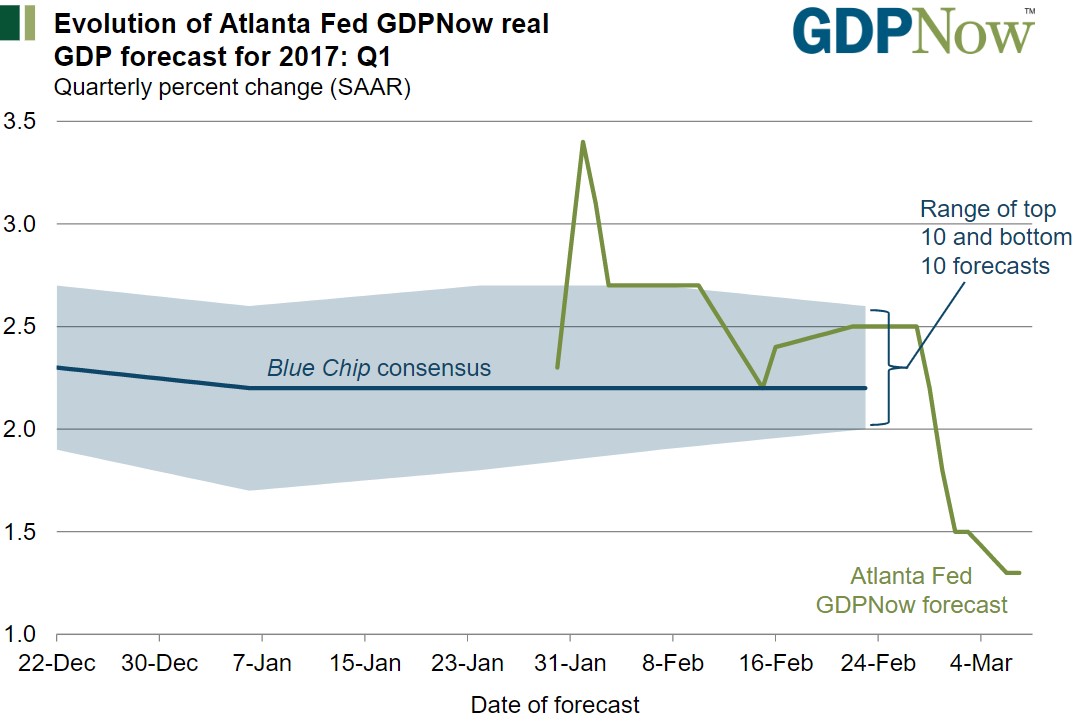
One big piece of economic news that was released on Tuesday was the Atlanta Fed’s GDP Now forecast for Q1. The forecast had a big dip lower from 1.8% to 1.3%. This decrease was caused by the forecast for real personal consumption expenditures growth slowing from 2.1% to 1.8% and the forecast for real nonresidential equipment growth slowing from 9.1% to 7.3%. These changes were caused by the weak motor vehicles sales report. I’ve discussed in the past the weakness I’m expecting to see when the auto market bubble bursts. It will get much worse than the February report. Also, the forecast for the contribution of inventory investment to Q1 GDP fell to -0.72% from -0.52% because of the latest manufacturing report.
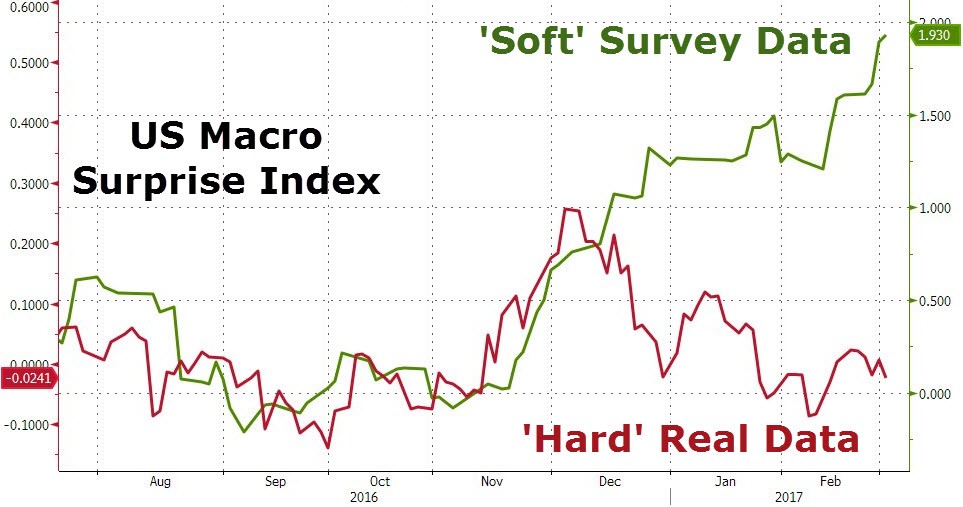
The optimism small businesses and investors are showing is about the future. The question remains if the present economy matters. Will the optimism continue if the economy continues to weaken before we get to the ‘promised land’ where taxes are cut and the economy accelerates? The reason why present data and even recent past data is important is because it acts as a signal for what the future may look like. Recent past data is much more relevant than optimism based on legislation which we don’t know the specifics of and may not pass. The U.S. Macro Surprise Index continues to show positive survey surprises while the real data surprises are stagnant.
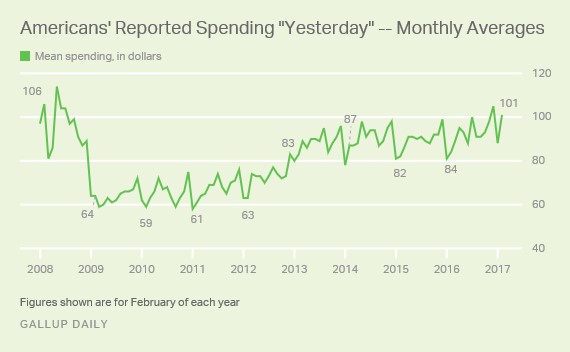
One example of a survey which shows consumers are optimistic is shown below. This is the Gallup survey which asks consumers how much money they spent yesterday. The chart shows the historical monthly averages since it was started in 2008. The numbers in the chart are the results for February of each year. The latest survey shows $101 was spent yesterday which was the highest reading in this cycle. It is $5 lower than the peak which was seen in 2008. Many other indicators are reaching the point they were at the top of the last cycle such as household debt. While it’s good to see consumer spending increasing, taking out debt to do so isn’t sustainable. The debt doesn’t necessarily have to be related to credit cards. High spending combined with high debt levels from auto loans and student loans is also a recipe for disaster.
An analogy for the economy is a person who realizes he has a good chance of getting a high paying job in 3 months so he spends money on his credit card now. He figures he will have enough money to pay his bills when he gets his job. The critical issues in this scenario are how much debt he takes out on his credit card and how likely it is that he will get the job he wants. For the economy, the critical issues are how much money consumers are borrowing in anticipation of future economic improvement before any of the pro-growth measures are passed and the likelihood the pro-growth measures have of being passed. I will review the likelihood of pro-growth measures being passed my next article.
As I mentioned, the consumer debt level is very high. As of the end of 2016, total household debt was $12.58 trillion which represents an increase of $226 billion. Household debt is $99 billion below its Q3 2008 peak of $12.68 billion. The NY Fed makes the wrong excuse that this time is different because delinquency rates are lower and the debt is different. Firstly, the debt being student loans and auto loans doesn’t mean it’s better than mortgages. A diploma doesn’t have any resale value and cars depreciate quickly; I could argue student loans and auto loans are much worse than mortgage debt. Housing prices declined in 2008, but that was a rare event- these two new bubbles decline as a rule.
Secondly, delinquencies aren’t rising because the labor market is strong and interest rates are low. It’s a misunderstanding of the bearish argument to claim delinquency trends are better than 2008 because it’s a false equivalency. There aren’t any bears claiming the Q4 2016 economy was as bad as the Q3 2008 economy. If that was the case, the economy would be exiting a recession later this year. This is clearly the wrong timetable. The bubble will be bigger this time; it clearly hasn’t crashed the way it did in 2008. No one knows for sure when it will crash, but since the household debt will be higher than last cycle, the bust will be worse. One final point I have is the labor market will get worse at some point which will cause the delinquencies to rise. We aren’t there yet, but weakness can start later this year if it becomes clear the fiscal policies won’t meet the hype small businesses have believed since the election.
Conclusion
The GDP Now Atlanta Fed forecast expects 1.3% growth for Q1 which would be a repeat of last year’s terrible first half growth. The reality is the only recent quarter which was good was the Q3 2016 report which was boosted 0.9% by a one-time shift higher in soybean exports. If the economy is going to grow below 2% in 2017, I don’t see how corporate profits will reach the 9.8% growth which is expected.
I estimate that the GOP’s fiscal policies will star to impact the real economy in the second half of 2018. It’s tough to justify bidding stocks higher when the next 6 quarters will be the same tepid growth we’ve seen this entire recovery. Household debt is too high. The tax cuts will be used to fund the debt that has already been accrued. Debt is pulling growth forward. If growth is already being pulled forward and the economy can’t grow at 2%, it’s a bad sign.