
After this week’s sell-off, you may find some bearish flags setting up as some stocks begin to stabilize. Identifying a potential reversal or a continuation in the trend can be extremely helpful. Here is a look at a bearish continuation pattern than may give you an entry within its bearish trend.
Bear Flag Basics
Rating: 2 Star
Directional Bias: Bearish
Pattern Type: Continuation
Pattern Description:
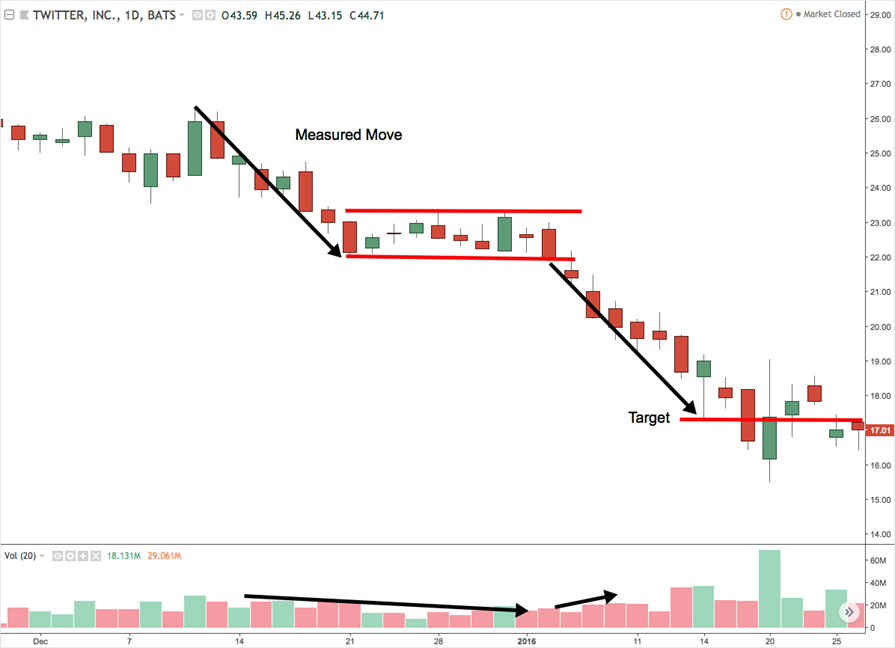
This pattern occurs within the context of a longer downtrend and following a steep, quick downward move. Following the move, the pattern then forms a short horizontal or upward sloping channel shaped like a flag. The flag portion of the pattern shouldn’t last more than 3-4 weeks if on a daily chart.
Volume Description:
Volume tends to drift downward during the formation and expand on the breakout.
Breakout Confirmation:
A close below the lower trend-line drawn across the lows with above average volume.
Measuring Technique:
Measure the length of the previous steep move leading into the flag, and then subtract that amount from the breakout level.
Statistical Notes:
Formations with more range between highs and lows perform better than shorter ranges. Flag formations that breakout in the direction of the prevailing market trend tend to perform better, and flags without gaps tend to perform better. Bull flags typically perform better than bear flags.
Conclusion
One of the hardest things to do is to know when to enter a bearish trade after a big move has already happened. Understanding the price and volume characteristics of a bear flag may give you more confidence of when to enter and what to expect from the movement in the stock.
Do you like price patterns and are looking to learn more about them? I have an upcoming class on December 16 for TheoTrade members. We would love you to join us by clicking here!
Wondering when to hedge? See how unlocking the Vomma Zone can help you better understand when volatility is about to rise.
Want to learn more about how to work with me? Check out Trader by Your Side!