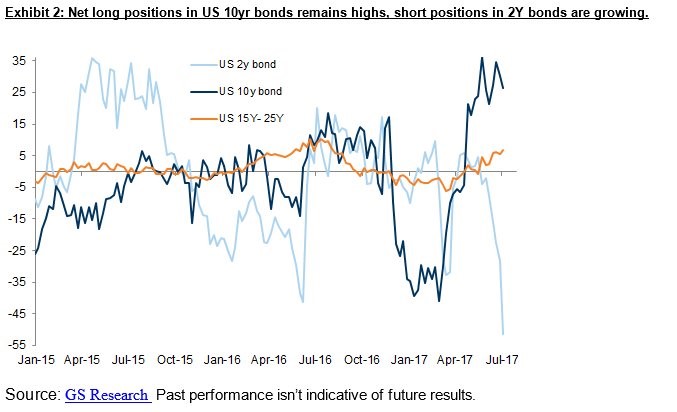
Earlier this year I used the positioning in the 10-year bond to predict a rally which lasted for over 3 months. It ended recently as yields have risen about 35 basis points in the past few weeks. Now we’re at a similar point with the 2-year bond. As you can see from the chart below, the positioning is more negative than the 10-year bond was in March. The long positioning in the ten-year hasn’t abated despite the recent selloff in the fast few weeks. This might mean the ten-year has further room to selloff. A rally in the 2-year would cause its yield to fall and a selloff in the 10-year would cause its yield to increase. This would mean the yield curve would steepen which is bullish for economic growth. It has already steepened 20 basis points in the past few weeks because of the selloff in the long bond which I have discussed in previous articles. The 2-year yield is more effected by Fed policy than the 10-year because the Fed sets near term rates. However, we’re in uncharted territory now that the balance sheet is about to be unwound. This analysis is shallow in terms of looking at the economy and monetary policy, but it’s worth noting because when everyone is leaning in one direction, the dam breaks and a reversal occurs.
Ethereum Crashes
Speaking of the dam breaking, the price of ethereum has crashed. It’s down over 50% as it hit $400 on some exchanges a few weeks ago and is now down below $200. The size of the upturn is highlighted by the size of this decline because it’s still up about 4-fold in the past 3 months. The way initial coin offerings were banking on the speculation in ethereum without having proper business models made it obvious that this cryptocurrency would crater. There isn’t a central bank ready to bailout these firms and investors like in the stock market. As a side note, there was a flash crash in the ethereum because of a huge batch of selling. Some of those trades which sold the currency at pennies were refunded even though there wasn’t anything wrong with the trading platform. I am expecting ethereum’s price to fall further in the next few months because this entire industry of making money off speculation on top of speculation needs to crater. The technology developed by ethereum might be ground breaking, but that doesn’t mean that the valuations of companies using the capital raising process are close to the truth.
Latest Economic Reports
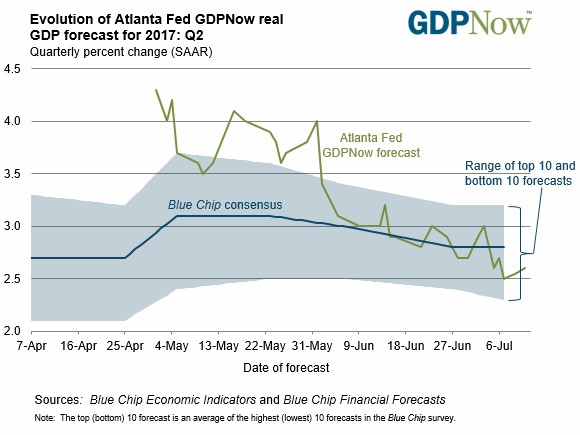
As you can see from the chart below, the blue-chip GDP consensus and the GDP Now forecast have come closer to my Q2 GDP expectation of between 2.0% and 2.5% growth. The GDP Now forecast was hurt by the Friday non-farm payrolls report. The NY Fed’s expectation remained stable at 1.96% as the difference between the two estimates shrinks. Last quarter saw a massive difference between them, but now there’s more cohesion making me more confident in my expectations.
As you may have noticed, I didn’t do any articles last week. Let’s quickly recap the jobs reports from last week and give an added point of analysis which was missed by the mainstream reports. The BLS and the ADP report had a strong difference in June which isn’t usual. After a month where there’s a large difference, the difference usually shrinks. The key is to figure out which one is telling the truth. The ADP report was the bad one which is different from the recent string of months which saw the BLS report as the more pessimistic one. The ADP headline only showed 158,000 jobs created. That’s the 4th worst report in the past 12 months. Looking deeper into the details makes it look worse than the headline as small businesses only added 17,000 jobs. This is different from the NFIB small business index which has been positive in the past few months. The very small businesses with 1-19 employees showed no growth at all in hiring as the goods producing sector took a nose dive, falling by 16,000 jobs. In the total report from all sizes, natural resources jobs fell by 4,000 which may be a result of declining oil prices.
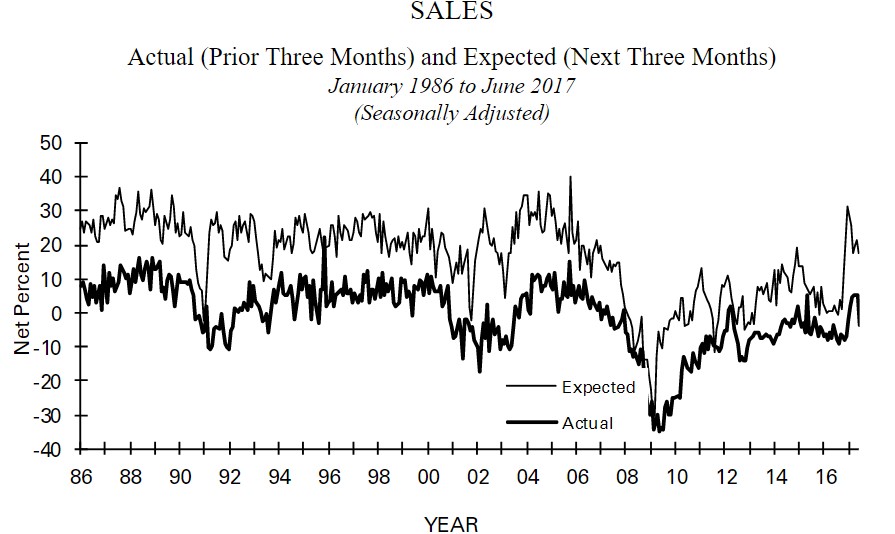
As I mentioned, the NFIB small business optimism index has been positive. However, in June it showed deceleration. A summary of the report is to say it went from excellent to good because of the political delays in passing fiscal stimulus. The overall index fell from 104.5 in May to 103.6 in June which is still a great number. It’s down 4 of the past 5 months from its cycle peak in January. Drilling down into the details, the index which measures actual sales fell from +5 to -4 which is the worst reading since December 2016. To be clear about the bifurcation between small businesses and large businesses, this index was negative every month except two from June 2012 to December 2016. February to May 2017 was an unusual streak of positivity which made some wonder if small businesses would see improvements to their margins again. This past month is a large set back.
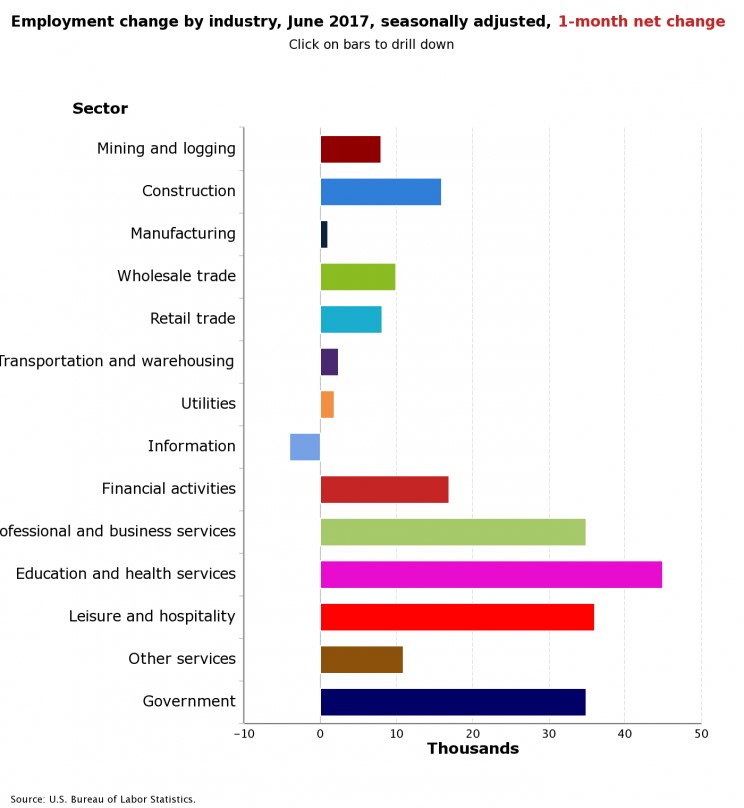
This scenario has led to strong hiring growth from small businesses in the past few years. The NFIB survey didn’t capture the weakness seen in the ADP report as the actual hiring index only fell from 18 to 15. I think the ADP report is overly negative given the positivity seen in the NFIB survey and BLS report. Moving on to the BLS report, the headline number was 222,000 jobs which beat expectations for 178,000 jobs. The labor force participation rate increased to 62.8% from 62.7% and the hourly workweek increased to 34.5 hours from 34.4 hours. The chart below shows the sector performances.
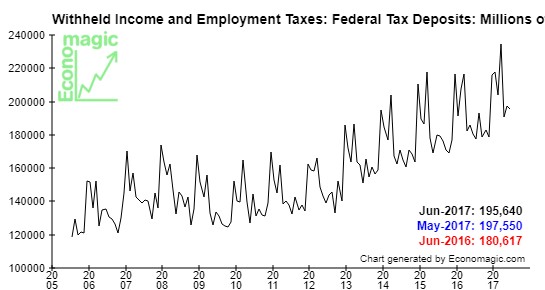
The one weak point in the BLS report was the 2.5% wage growth which missed expectations for 2.6% growth. I don’t see this as an issue because of the chart below which shows that tax withholdings were up 8.3% year over year in June. This is hard data which shows total earnings in the economy in terms of withheld income and employment taxes. While small businesses may have either had a minor blip or a larger fall, the overall economy continues to hum along fine.