The Dow has fallen two days in a row for the first time since the election as negative data was able to temporarily stop the Dow from reaching the much heralded 20,000 level. It’s quite amusing to see the media and traders get disappointed from such a meaningless number not being reached. I think the market should’ve fallen more than it did, but then again, I don’t think this Trump rally makes sense either, so my thinking is quite far from the market’s thinking. In this article, I’ll review some of the disappointing data points released Thursday along with other charts I’ve found interesting. I’m still a bear on equities.
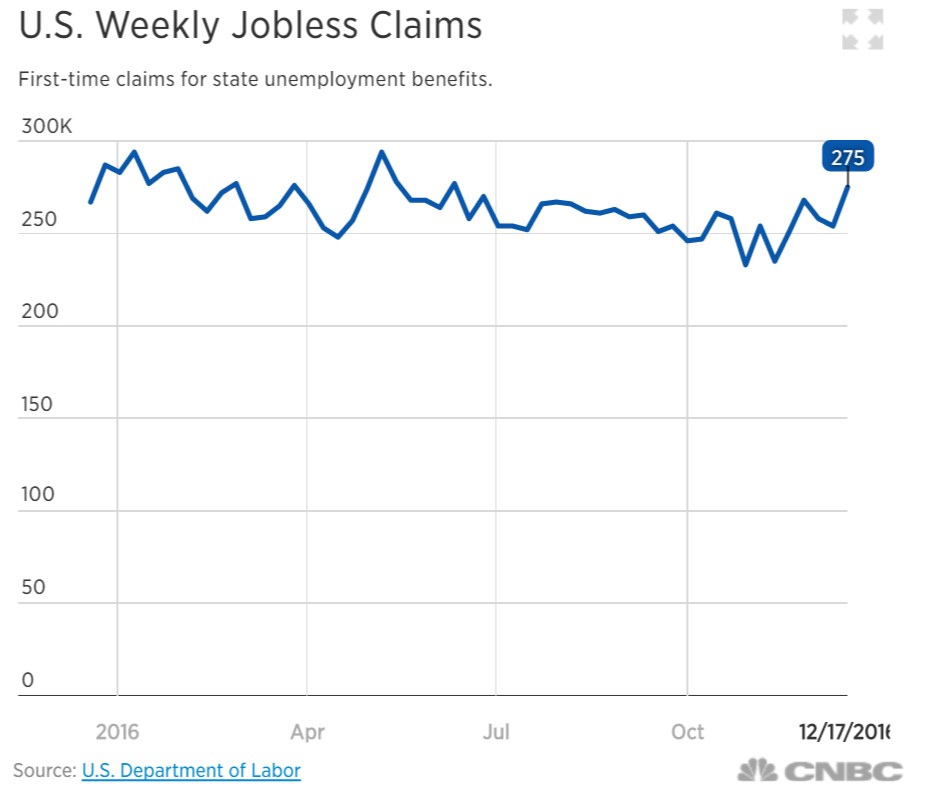
The first chart is the weekly jobless claims which increased to 275,000. This was much higher than the 256,000 expected. Economists are predicting jobless claims will be lower forever, unemployment will never increase again, and the economy will never have another recession. Personally, I feel this renders economists obsolete. Yes, it’s tough forecast the economy, but that forecast is like a broken clock; it never changes. The four-week average of claims increased 10,750 from November to December. November saw 178,000 jobs created, so that means December could see job growth below 150,000. It’s interesting to see the data deteriorating right after the Fed raised rates. The rate hike didn’t cause the increase in claims, but it looks like the hiked was bad timing if this is the start of a greater trend.
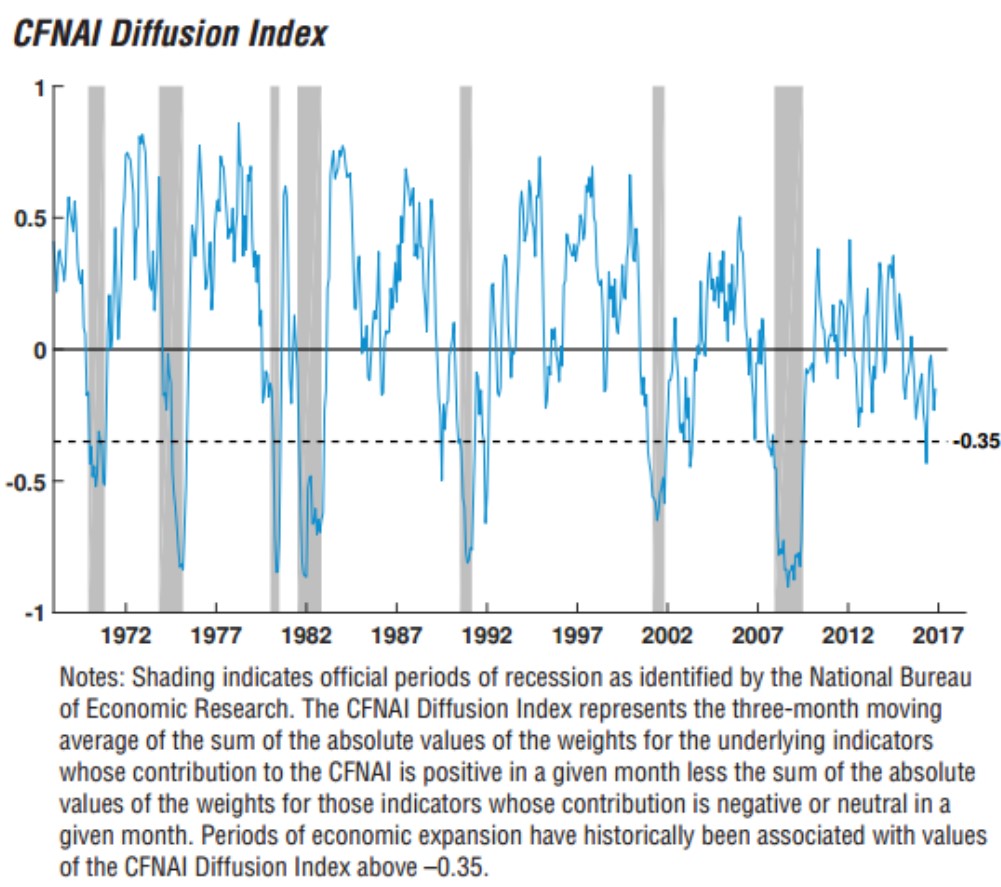
The Chicago Fed’s Notional Activity Index fell 0.27 points which was the lowest reading in 3 months. The report was benign showing neither a trend in the positive or negative direction as the economy treads water. 44 indicators fell from October to November and 41 rose. The most interesting chart in the report was the CFNAI Diffusion Index. Any reading below -0.35 is associated with a recession. The reading hit below that level a few months ago. The 3 other times this happened outside a recession, the economy was either coming out of one or headed towards one. Since the economy isn’t coming out of a recession, if it doesn’t go into a recession in 2017, it would be the first time in the past 40 years for a below -0.35 reading to happen away from one.
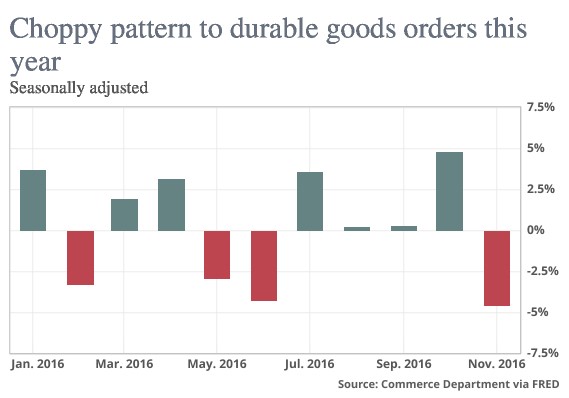
Durable goods orders fell for the first time in 5 months, falling 4.6%. Orders for civilian aircrafts fell 73.5% because of a decline in Boeing’s orders. Excluding transportation, orders rose 0.5%. The data isn’t changing enough to explain the rapid increase in stocks. It looks to be more of the same slow growth as GDP growth decelerates from the 3.5% annualized growth rate in Q3 which was driven by soybean exports which increased because of a one-time weather event.
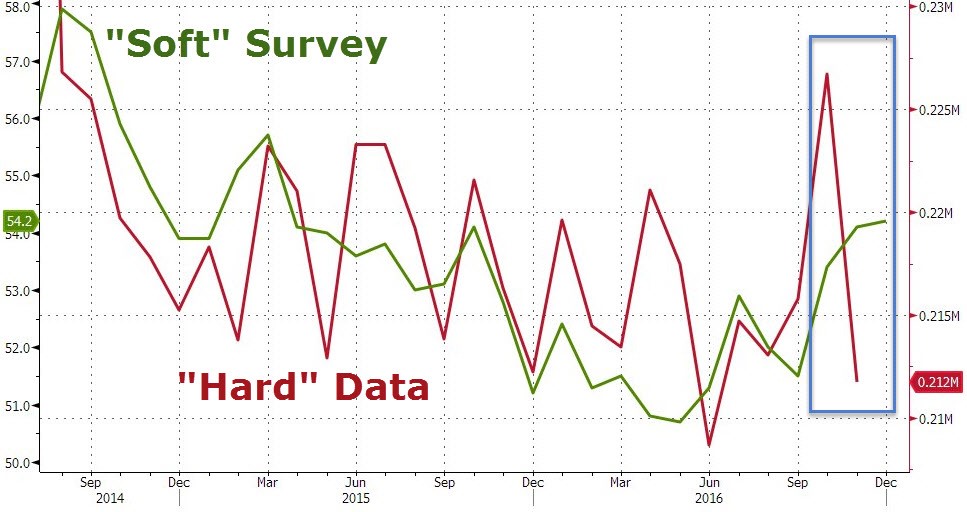
The poor data which was reported Thursday was mostly hard data while the good data of the prior few weeks has been mainly soft data (surveys). The divergence may be explained by the hope for an economic acceleration brought by Trump. Businesses want to ignore the current reality because of what Trump promises to do in 2017.
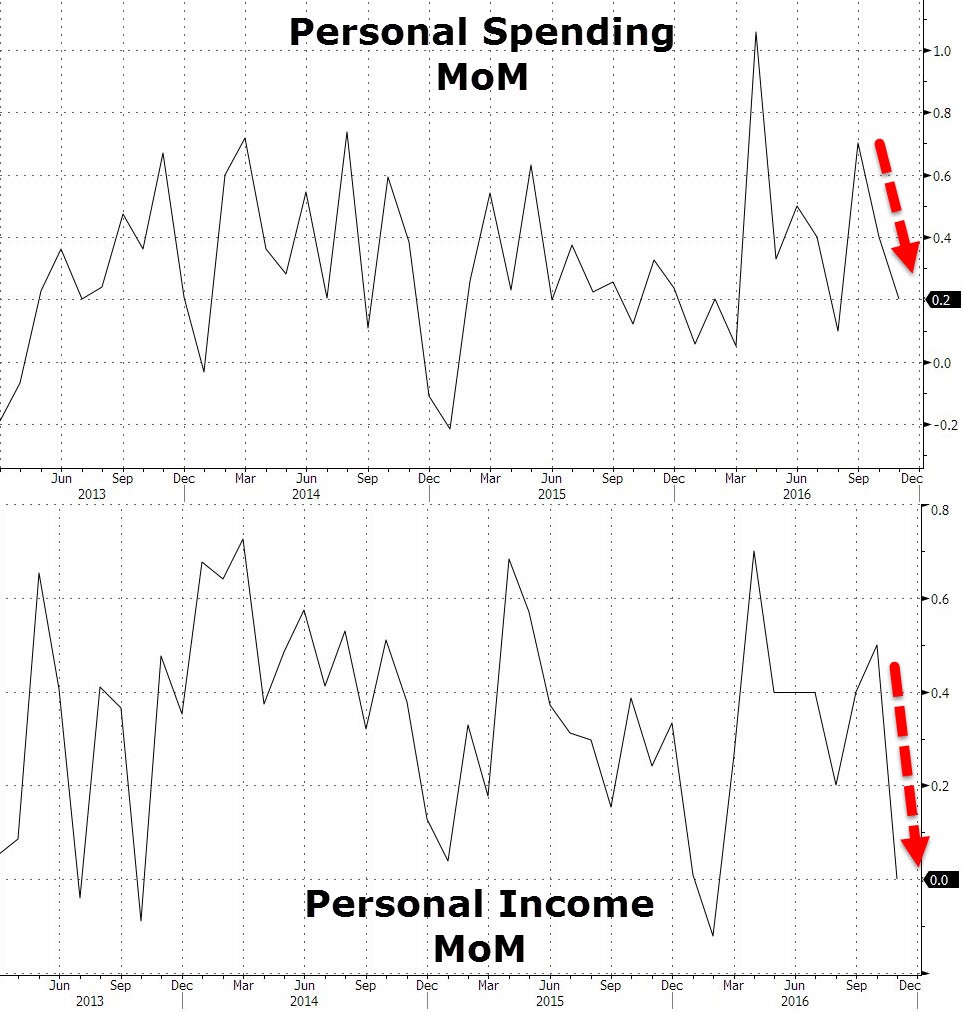
On a positive note, annual spending growth was up 4.2% and annual income growth was up 3.5%. However, on a month over month basis, as shown in the charts below, both data points were below expectations as personal spending was up 0.2% and income growth was flat. Trump was elected to fix income growth, so I’ll be focused on this data point in 2017.
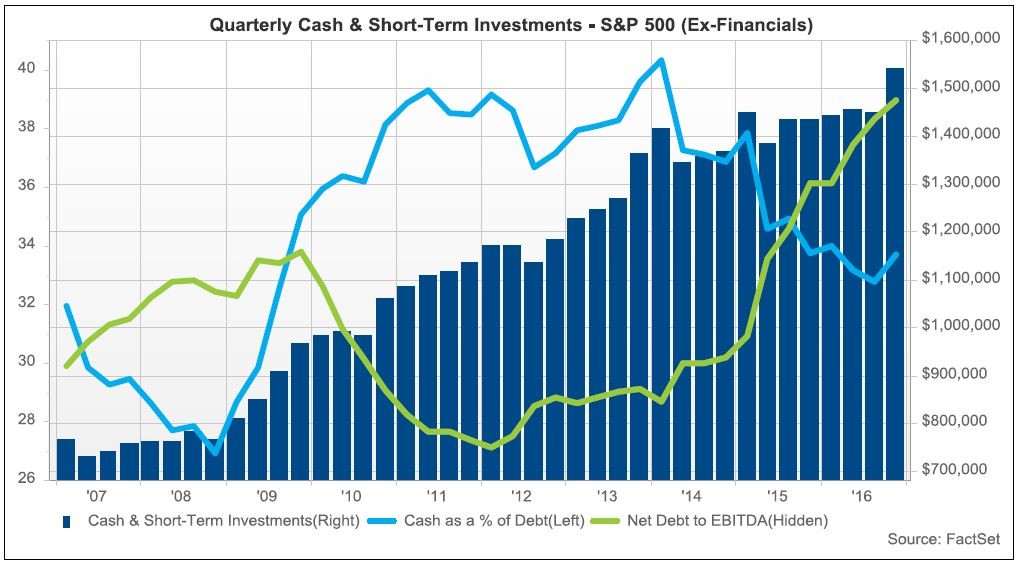
The chart below shows the cash and debt on non-financial S&P 500 firms’ balance sheets. Cash had a big leap as it was up 6.3% from Q2. As you can see, the corporate debt bubble is enormous as the net debt to EBITDA ratio far exceeds the peak in 2009. Cash improved at such a fast pace, it finally exceeded debt growth. This is because the negative earnings growth trend ended. This doesn’t make up for the fact that the cash as a percentage of debt has been declining since 2014, while stocks are making record highs.
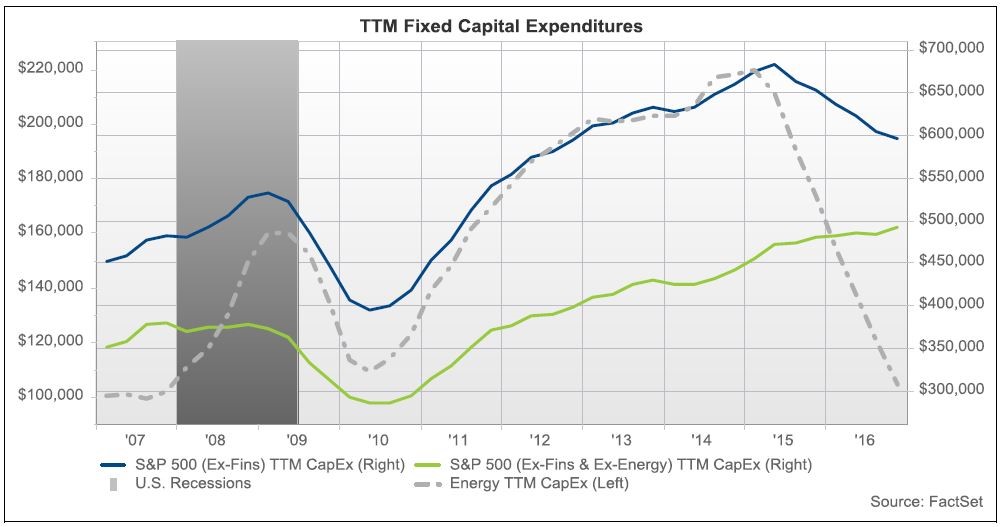
The chart below is one of the reasons why my bearish stock market call was so wrong in 2016. Energy firms had a massive decline in capital expenditures while the rest of the economy has remained in good health. I though energy was a leading indicator for a decline in expenditures because there’s always a sector which leads declines. However, this was not the case. These energy expenditures will rebound in 2017 which makes the odds of the total ex-financials cap-ex declining in 2017 less likely.
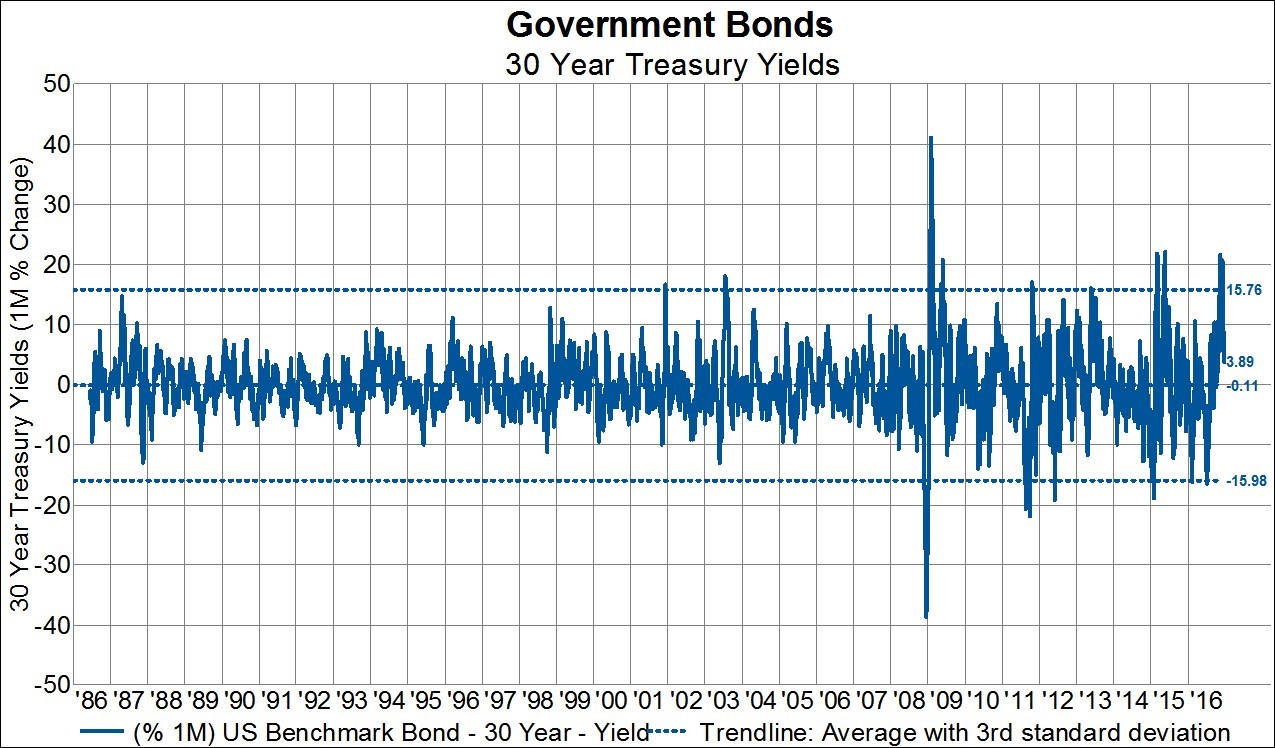
Trump’s election has caused a big self-off in bonds as inflation expectations rose due to Trump’s expected growth plans which have the goal of lowering taxes, cutting regulations, and possibly increasing spending. The chart below has bounds which represent 3 standard deviation moves. Yields have surpassed a 3-standard deviation increase which means the increase will likely revert back to the mean shortly. Since the financial crisis, we’ve seen 11 of these large moves. If the yields do revert to the mean, it would support my thesis that interest rates will fall in 2017.
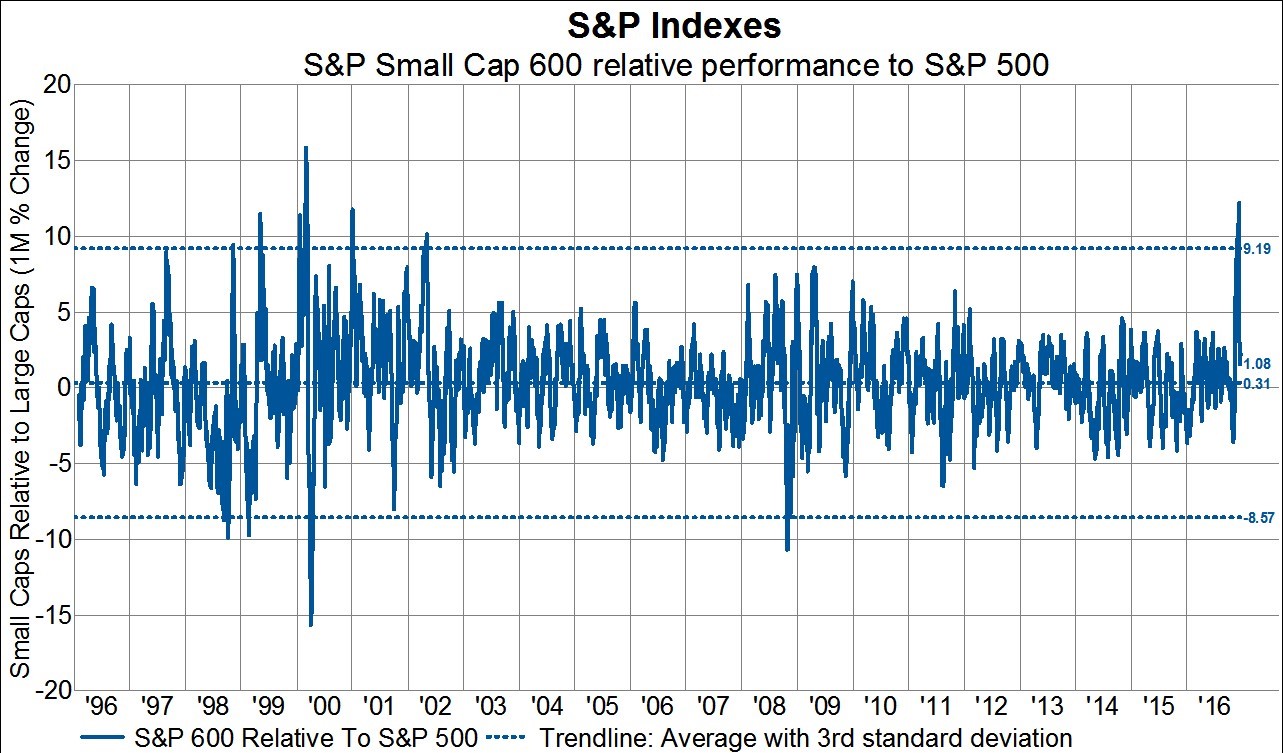
Trump’s deregulation is supposed to help small caps, so they have risen exponentially since the election. The chart below has data updated as of December 8th. The small cap S&P 600 outperformed the S&P 500 by 11% in the past month. This is the largest 1 month outperformance since March 2000 and the first 3 standard deviation move since 2002. I expect the relative outperformance of the small cap stocks to reverse as excitement over Trump wains in a ‘buy the rumor, sell the news’ fashion.
Conclusion
The Dow failed to reach 20,000 on Thursday for good reason. Disappointing hard economic data was reported. If the jobless claims rise a little further, it will finally end the streak of being below 300,000 which is now the longest one since 1969 when the labor market was about half the size. I expect long term bonds and small cap stocks to revert to their means. I also expect stocks to sell off after Trump is sworn in.