Another Great Housing Market Report
Yet another solid housing market report came out in the Pending Home Sales index. The July reading wasn’t that great as the index fell 2.5% to 105.6. But the August index was strong as it increased 1.6% to 107.3. This makes it look like the new home sales report as June was the high for the year, July was weaker. And, August was strong, but below June’s reading.
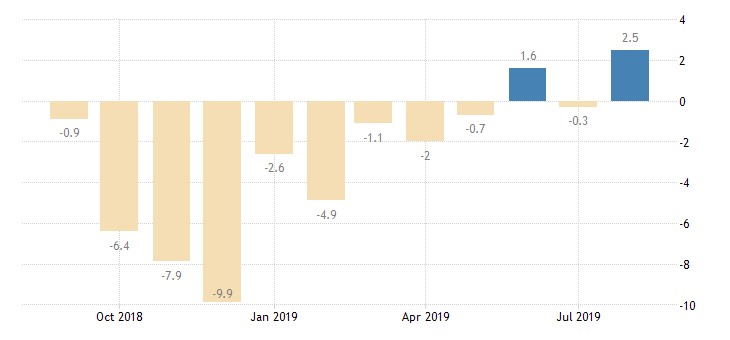
As you can see from the chart below, yearly growth improved from -0.3% to 2.5%. Yearly growth is about to be very strong in Q4 because the comps are easy. The index was 102.2, 101, and 98.7 in the last 3 months of 2018.
Just like the new home sales report, the West had the strongest monthly and yearly pending home sales growth. It had monthly growth of 3.1% and yearly growth of 8%. Even though it had great growth, it was the 2nd worst region. Its index was below 100. It signals that contract signing activity was below the historical average.
Activity was also below the historical average in the Northeast which had a reading of just 94.3. Two above 100 were the Midwest and the South which had readings of 101.7 and 124.4. Midwest had the weakest growth as its monthly growth was 0.6% and its yearly growth was 0.2%. South had monthly growth of 1.4% and yearly growth of 1.8%. It’s by far the biggest housing market. It’s 60% of the new home sales market.
Housing Market To Get Even Stronger In Q4
Monthly pending home sales growth beat estimates for 0.6%. It’s interesting that new home sales growth and pending home sales growth have been so highly correlated because contract signings usually lead sales by 45 to 60 days. Pending home sales improvement implies good new home sales growth in September and October.
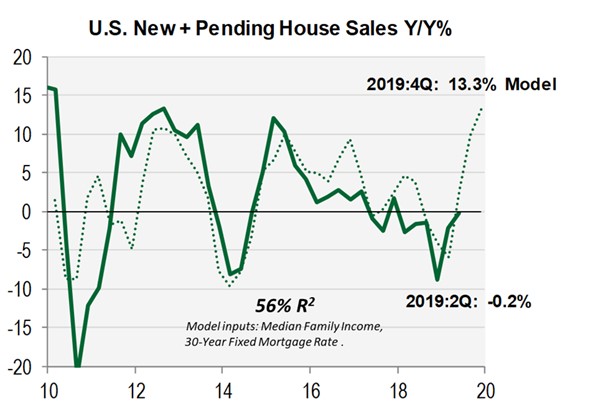
Which implies great housing starts growth in Q4. As you can see from the chart below, Cornerstone Macro’s model for new and pending home sales projects 13.3% growth. That's based on median family income and the average 30 year fixed mortgage rate.
This week, the average 30 year fixed rate fell 9 basis points to 3.64%. It is now 15 basis points above its recent low made at the start of the month. I think mortgage rates will continue to fall since the spike in yields ended a couple weeks ago. We might even see rates fall below the September 5th low.
Rates don’t need to fall further for the housing market to improve since rates were higher in July and August and the housing reports from then have been great. A key is for treasury yields to not spike like they did in the first 2 weeks of September. From Q2 to Q3, the housing market went from being weak, to showing modest growth. That’s amazing in rate of change terms. It will go from ok to good/great in Q4.
Slight Improvement In Kansas City Fed Index
Based on the 4 September regional Fed manufacturing reports, it appears manufacturing growth is near the flatline. This sector might be modestly growing like the Markit flash manufacturing PMI suggested. A main reason investors might see the ISM PMI increasing is because it was only 49.1 in August.
Personally, I don’t see the sector improving. I see the PMI becoming more accurate. If the PMI increases 1 point to above 50, the media might make a fuss about it, but it’s not a big deal either way. Manufacturing is in a broad based slowdown, but the sector has avoided a deep recession. This is a highly cyclical sector which means the longer it doesn’t plummet, the more likely it is closing in on the end of this slowdown.
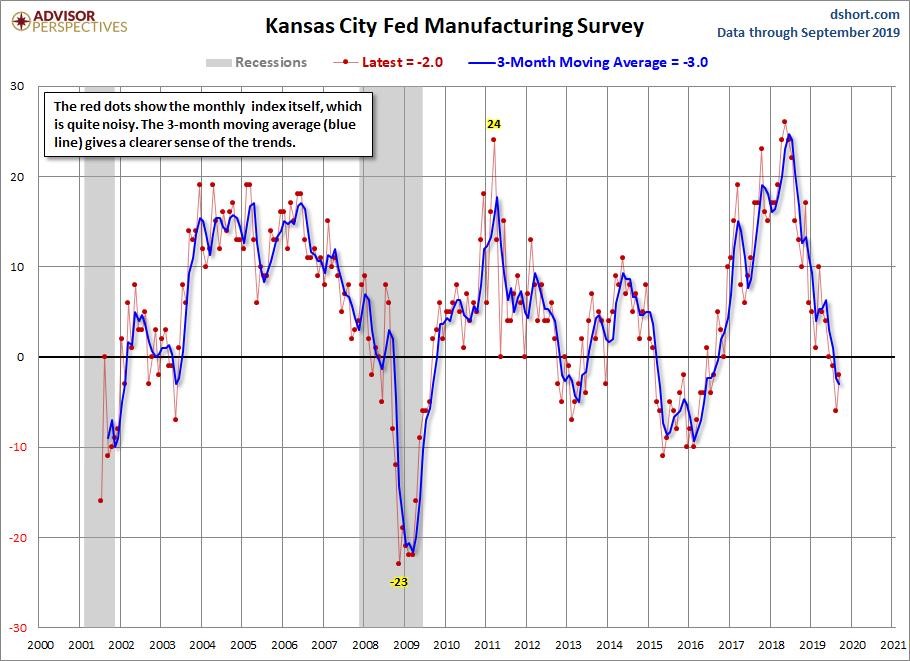
Specifically, the Kansas City Fed manufacturing index improved from -6 to -2 which beat estimates for -3. It’s the 4th of the 5 regional Fed manufacturing reports to come out. Last is the Dallas Fed report on Monday. The ISM and Markit manufacturing reports come out on Tuesday.
As you can see from the chart below, the 3 month moving average is -3 which is near the trough in 2013, but solidly above the trough of about -10 in 2016. Everyone is tempted to wonder if the economy is near a recession like 2008, but few consider that if this is a slowdown, this is nearly as bad as it gets and it’s a few months from ending.
Production index actually rose from -2 to 10 and the volume of shipments index increased from -7 to 9. Volume of new orders index was up from -16 to -3. This doesn’t exactly scream “manufacturing recession.” Like most of the other regional Fed reports, the survey data on expectations weakened. Composite index fell from 11 to 5. Production and shipments indexes cratered from 23 and 20 to 5 for both. Capex index fell from 12 to just 6.
Now let’s look at the quotes from this report to explain why expectations were so weak. Weakness is probably related to the trade war as 2 firms mentioned it as an issue. One firm stated, “We have had to delay capital spending due mainly to high tariff taxes that we cannot pass along.” This issue is the same for retailers as they are taking margin declines instead of raising prices. This explains why real consumption growth isn’t being impacted by the tariffs.
Another firm stated, “Trade deals are important. 50%+ exports for us is to Mexico and Canada. Election year looks to be slowing decisions for customers already.” It’s concerning that the election is already an issue for businesses. It’s still over one year away.
Conclusion
Pending home sales signal more positive growth coming from new home sales over the next few months. We could be looking at above 2% GDP growth in Q4 if real residential investment growth accelerates. Without real residential investment growth being a drag in Q3, GDP growth could be close to 2.5%. There won’t be a recession this year. I’m highly confident in that assessment.