Optimistic Consumers - Very Large Consumer Confidence Improvement
June is showing a spike in Optimistic Consumers. The June Conference Board consumer confidence index was revised higher from 121.5 to 124.3. Which makes sense considering how solid the retail sales report was.
Even more impressively, the index exploded higher in July to 135.7. It beat estimates for 125 and the high end of the estimate range which was 128. This index was likely helped by the trade negotiations with China.
Unfortunately, President Trump just announced new tariffs on China. That means this great reading could be reversed. This situation is highly unpredictable in the short run. So it’s entirely possible a deal is worked out within the next couple weeks to delay the new tariffs.
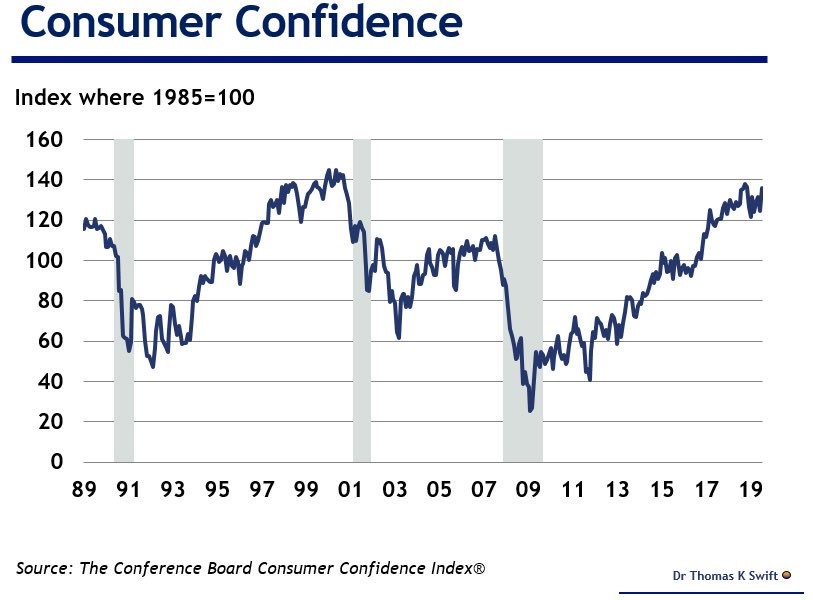
As you can see from the chart above, the July consumer confidence reading was the strongest of the year and the 3rd highest of the economic cycle.
This report was helped by the trade negotiations
Optimistic Consumers - Expectations index drove most of the increase. The Present Situation index increased from 164.3 to 170.9. That’s a solid indicator retail sales growth will be strong in July which is the month before back to school season.
Expectations index exploded higher as it went from 97.6 to 112.3. Those who follow the difference between present conditions and expectations will be pleased. Personally, I don’t see it as a recession warning if the present index is way higher than the expectations index.
Consumer confidence is usually high before recessions, but it can stay high for several quarters. If you predicted a recession based on such high confidence, you already have been wrong for about a year.
Optimistic Consumers - Details Of This Great Consumer Confidence Report
Unsurprisingly, the consumer confidence index had a lot of strength in its components. For example, only 6.3% of consumers expected their income to decrease over the next 6 months which is the fewest in 18.5 years. That’s in tune with the big positive revision to income growth that pushed the savings rate higher in recent quarters.
Interestingly, 2.3% expect to buy a new home within the next 6 months which is the highest percentage in history. That’s an odd reading because the housing market has been weak.
The consumer also showed high confidence when reviewing the labor market. Those saying jobs are “plentiful” increased from 44% to 46.2% which is consistent with a healthy labor market. Percentage saying jobs are “hard to get” fell from 15.8% to 12.8%.
Surveys on the labor market are the most important. Most consumers aren’t extremely knowledgeable about the economy. But they are experts on their own job prospects. Percentage expecting their short term income prospects to improve increased from 20.5% to 24.7%.
Home Price Growth Falls Again
Optimistic Consumers - Yearly home price growth fell again in May. That’s based on the Case Shiller index. The FHFA index also showed growth fell, but it had growth at a higher level (5%).
In the Case Shiller index, national home price growth fell from 3.5% to 3.4%. That’s a relatively strong decline. Home price growth fell by about 15 basis points in May 2018 from April as it was 6.3%. Growth fell despite an easier comp.
Comps are going to get much easier in the coming months. I wouldn’t be surprised if yearly growth stopped declining. Yearly growth will probably only fall below zero if there is weakness in the labor market or if interest rates rise.
With the latest Fed rate cut and the decline in treasury yields, investors don’t see any chance of mortgage rates rising in the next few months.
Optimistic Consumers - Average 30 year fixed mortgage rate was 3.75% as of August 1st. That’s just 2 basis points above the recent trough in June.
As you can see from the chart below, on an inflation adjusted basis, the national home price index had 0% monthly growth and just 0.1% yearly growth. This chart uses the owners’ equivalent rent inflation rate to calculate real growth.
To be clear, shelter inflation isn’t the same as the growth in the national price index. It would always zero out if that was the case. It’s notable how the two aren’t highly correlated.
That’s what makes this chart interesting. For much of this cycle shelter inflation has been higher than overall inflation. Home price growth has been more volatile.
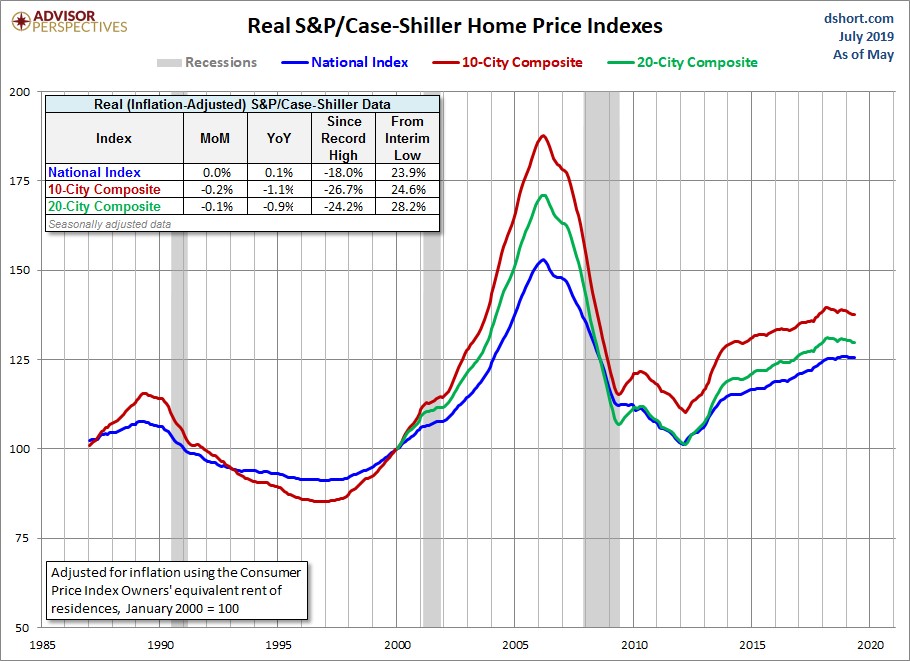
The seasonally adjusted 20 city index had 0.1% monthly growth which missed estimates for 0.2% growth and was above the flat growth in April. On a non-seasonally adjusted basis, monthly growth was 0.6%.
Itmet the consensus and was below April’s growth of 0.8%. On a yearly basis, non-seasonally adjusted home price growth was weaker than national growth as it fell from 2.5% to 2.4% which met estimates.
Optimistic Consumers - Performance Of Individual Cities
Seattle finally hit the negative mark for yearly growth as I expected. Yearly growth fell from slightly positive to -1.2%. That’s the weakest reading since March 2012. The growth peak of this entire expansion was in May of 2018 when growth was 13.6%.
If there was ever going to be a negative growth reading, it was going to be this month. It’s easy to see the decline in growth bottoming here or in the next few months as the comps get easier. Price growth in Las Vegas, which has been the hottest market, took a big step back in May as it fell from 7.1% to 6.4%.
This growth rate has plenty of room to fall as its recent peak was in August 2018. I expect yearly growth to fall below 5% in the next 3 reports. Growth in Denver, which also had been one of the hottest markets from 2015-2018, saw growth fall modestly from 3.8% to 3.6%.
Finally, let’s look at markets which didn’t have big bursts in the past few years. Washington D.C. saw price growth increase from 2.7% to 2.9%.
As expected, it’s rate of change was much better than the previously hot areas. New York didn’t face terribly tough comps. But its growth rate still fell from 2.1% to 1.9% which is the lowest growth rate since January 2015.