Geopolitical Risk
The market calmed down on Friday which was slightly surprising because of the North Korean threat. Investors didn’t have a problem going into the weekend with their money invested in stocks even though the situation could become volatile again. The S&P 500 was up 0.13% and the Nasdaq was up 0.64% as Amazon recovered slightly (up 1.16%). The S&P 500 is now only 1.5% off its all-time closing high as if nothing happened this past week. My back of the envelop calculations said the market should be down 2%. Even the threat of nuclear war can’t bring the first 5% selloff of the year.
In President Trump’s latest statements, he sought to de-escalate the situation saying that “Nobody loves a peaceful solution more than President Trump, that I can tell you … But we will see what happens. We think that lots of good things could happen, and we could also have a bad solution.” Trump seems to be all bark and no bite as he hasn’t taken any military action. The stock market may not realize this strategy which could be something it will need to get used to as Trump also mentioned invading Venezuela. North Korea is the ultimate all-bark and no bite country as it is economically weak and would never preemptively attack Guam as that would insure the U.S. acting to counter that attack. The key risks are an American pre-emptive strike and an economic war with China. Trump had a phone call with Chinese President Xi Jinping on Friday where Jinping told Trump “China and the US have a common interest in realizing the denuclearization of the Korean Peninsula and maintaining peace and stability on the Korean Peninsula.”
I’m not willing to signal an all-clear sign, but you can now see why stocks rallied on Friday as the risks are diminishing as quickly as they came about. I only recommend adjusting your investing strategy if you have short term aspirations. In the long run, it’s unlikely to affect earnings growth.
Is Housing In A Bubble?
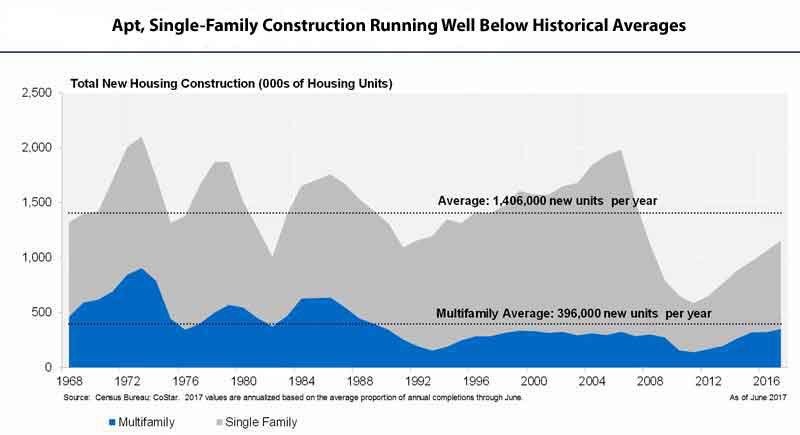
Let’s look at two housing construction related charts to see if housing is in a bubble. The chart below shows the total new housing construction and the multifamily housing construction. As you can see, the new housing construction is below historical averages as it hasn’t recovered from the 2008 financial crisis. Multifamily averages haven’t been met either. I am not in the camp that housing is in a bubble because the lending standards aren’t low like in the early 2000s. This chart is unlike the apartments constructed which have rebounded to meet demand. I don’t expect housing construction to meet the previous high because the homeownership rate is near the levels last seen in the 1970s. However, this chart is signaling that there isn’t anything dire about to occur.
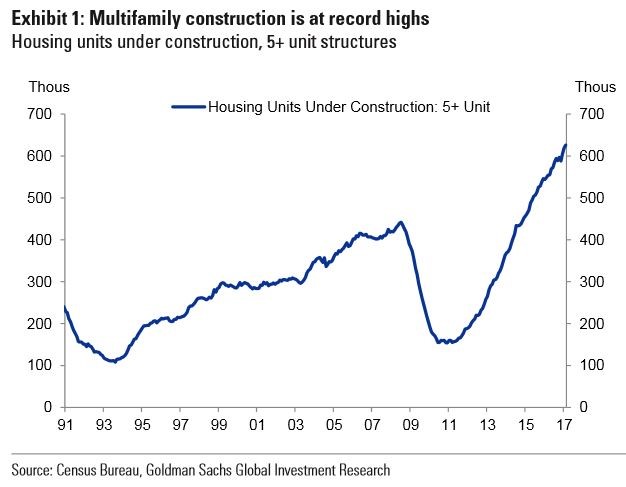
The chart below implies the exact opposite of what the chart above implies. It shows that the number of 5+ multifamily unit structures has reached a new all-time high which far surpasses the levels seen in 2008. The reason for this is because many of these big unit housing constructions are in cities which are experiencing price booms. This is a specific chart which expresses that there are some cities which have seen housing prices appreciate faster than the national average. Low interest rates, millennials moving to cities, and the strong labor market all support housing prices rising. Historically, there have been many times where cities have gotten overheated. The national collapse that happened in 2008 was unprecedented. Some investors are scared that price appreciation will lead to the same collapse. That fear is unwarranted as only some cities like Seattle and Portland have been experienced booms. Seattle’s year over year Case Shiller home price index is up 12.3% year over year. Seattle can have a slowdown in the next few years without a national crisis.
Q3 GDP Expectations Are Optimistic
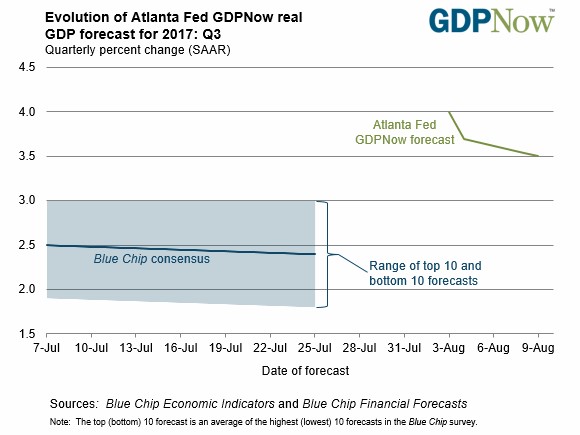
While it’s too early to take the GDP forecasts seriously, looking at them is still worth doing to get a framework of how the quarter is shaping up. Unless the economy falls off a cliff, there is almost no chance of a recession in 2017. As you can see in the chart below, the blue chip analysts expect a 2.4% GDP growth rate and the Atlanta Fed is at a widely optimistic 3.5%. Its latest change was a 0.2% drop due to changes in expectations for inventory investments. The forecast can vacillate wildly because most of the data isn’t in yet. The NY Fed’s estimate is more reliable early in the quarter. It expects Q3 GDP to be 1.96%. It has vacillated between 1.54% and 1.98% meaning it has been steady. I think that makes more sense than the wide variations seen in the GDP Now report considering how consistent the data is. It will never be perfect, but July looks like it was similar to May and June.
The St. Louis Fed is in left field along with the Atlanta Fed as it expects 3.68% growth. I have previously said it’s unlikely for a year to have 3% GDP growth unless productivity rebounds. That doesn’t make it impossible for one quarter to jump above 3%. The reason I’m skeptical is because we have seen optimism wane as quarters progress throughout this recovery. Last quarter was initially expected to see 4% growth, but it ended up being 2.8%.
Conclusion
The North Korean risk has died down. This might allow stocks to hit another record high in August. It’s tough to predict where stocks will go as volumes will surely be down across the board due to seasonality; I think the chance of the first 5% correction occurring has diminished. The housing market isn’t in a bubble, but I wouldn’t buy a house in the heated areas like Seattle. The Fed’s forecast for Q3 is optimistic, but growth at a two handle again is reasonable. You can’t go wrong when you have a strong labor market, dovish Fed, and low inflation.