This week will be the first week where earnings start to flow in quicker. So far, as of July 13th, 30 firms have reported earnings. Of the 30, 24 beat, 3 matched, and 3 missed estimates. An 80% beat rate is very high, but it’s too early to call it a signal for how the quarter will play out. Certainly, the estimates are high. Only 4.81% sales growth is expected, but in terms of profitability Q2 should be amazing. At $116.34, trailing twelve-month operating earnings are expected to reach their all-time high. At $105.04 trailing-twelve month as reported earnings will miss their all-time high by 92 cents. As I have previously discussed, the margin improvement is driving this profit growth as margins are expected to be 10.40% which is 0.30% higher than the Q3 2014 peak. I don’t expect margins to get much higher as I see deceleration in sequential margin growth starting in Q3 partially because of energy weakness.
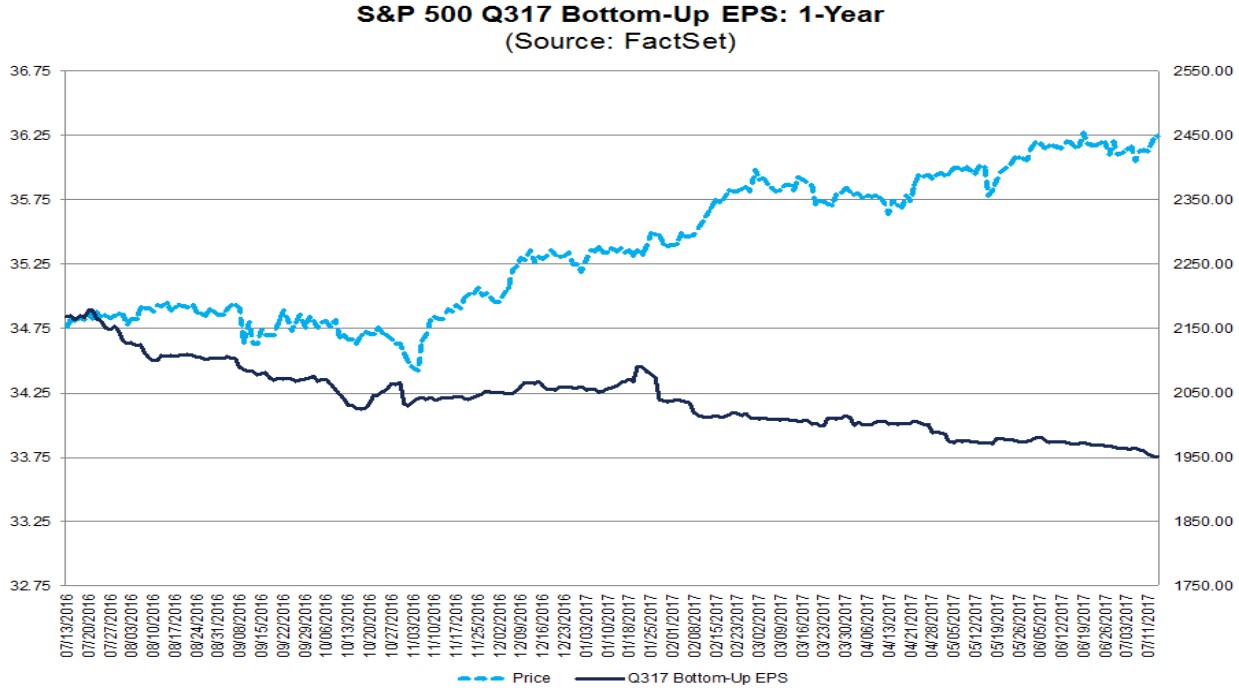
My below consensus expectations begin in Q3. Interestingly, even though only 1 out of 6 firms has issued negative guidance for Q3 and 80% of firms have beaten estimates, the bottom-up EPS estimates for Q3 have fallen recently as you can see at the right end of the chart. In the past year, Q3 estimates have fallen over a dollar. In Q3, earnings are expected to be up 7.1% and sales are expected to be up 5.0%, meaning sales growth is expected to accelerate and margin growth is expected to slow. That estimate is the starting point, meaning it will likely come in over the next few weeks making Q3 have less robust growth than the prior two quarters. Energy earnings still have 3 quarters of easy comparables (including this quarter) as Q2 earnings are expected to be up 357.4% year over year.
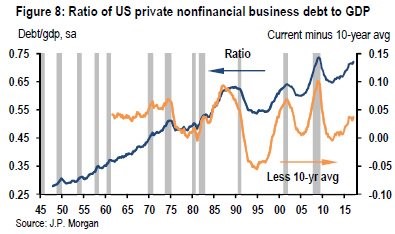
Timing the business cycle will help us predict when the earnings growth trend will end. I have expressed many times what the blue line in the chart below shows. The ratio of corporate debt to GDP is near its all-time high. I am open to the fact that I may be interpreting this information wrong. A potential mistake with this chart is that businesses can grow profits faster than GDP because of international sales. I wouldn’t even compare corporate growth to global GDP growth because U.S. firms can take market share from global competitors. These factors make this chart less predictive of a recession than I initially stated. If you say that corporate debt to GDP will peak at the same rate as 2008, you are saying this multi-decade trend of rising corporate debt to GDP will end. The orange line is a better way to measure the cycle. In using the 10-year average, it has captured the timing of previous cycles turning. Currently we aren’t near a turn according to this metric.
The corporate debt levels should still be a focus even though they may not be at a level which is supporting the ‘impending doom’ narrative. The reason is because the debt is likely more toxic than the past because of the normalization of covenant lite loans which have higher interest rates, but less restrictions. It reminds me of the 2000s era where loans were given out to house buyers without a care because the value of the house would always go up. I think this mistake is brought about by the need for yield at all costs. Covenant lite loans are a twist on junk debt because instead of knowing the business is weak and the balance sheet is over leveraged, you have a business which is in better shape, but you give up that updated information. The combination of covenant lite loans and junk debt is a recipe for disaster. It’s like doing an obstacle course blindfolded.
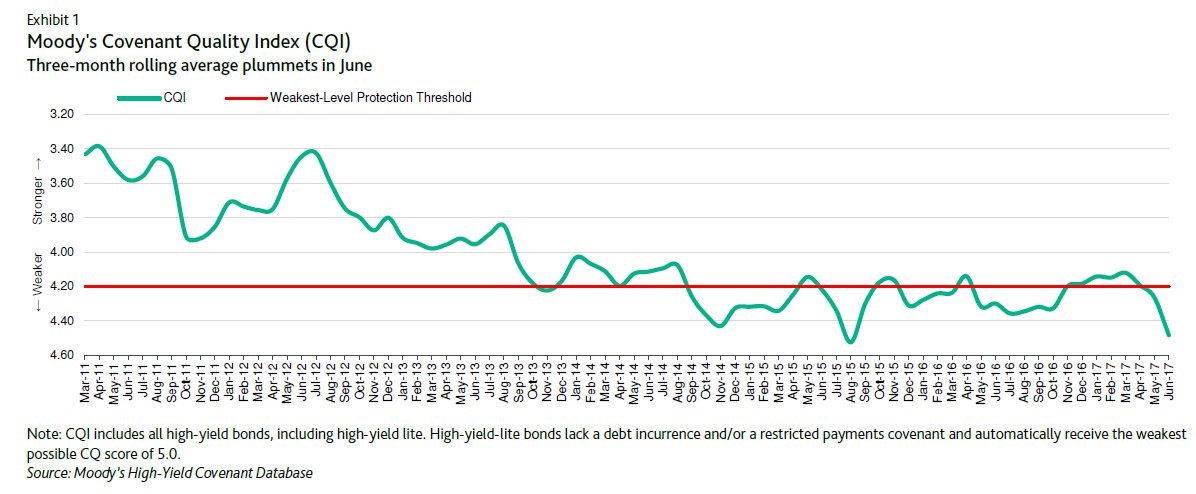
High yield lite bonds that lack debt incurrences and/or a restricted payments covenant get a 5.0 which is the lowest score in the CQI indicator seen below. A debt incurrence is a legal restriction that prohibits debt to be issued at the same seniority if certain financial ratios aren’t met. It’s a disaster waiting to happen if you invest in a junk bond which doesn’t have to meet any financial ratios. A restricted payments covenant is a limit to the dividends, distributions, certain investments, and certain repurchases of junior debt and stock to make sure the company has enough money to pay back their bonds. Obviously, not having this restriction means reckless behavior can occur. A business which is about to go under could decide to pay dividends which could help stockholders at the expense of senior bondholders.
The crazy situation that we’re in now is these bonds which lack restrictions on junk debt are the norm. The CQI index is at 4.48 which slightly above its record low of 4.52. I’m not sure what Moody’s means by its weakest level protection threshold, but I’m assuming any reading below that means bondholders are taking too much risk, in aggregate.
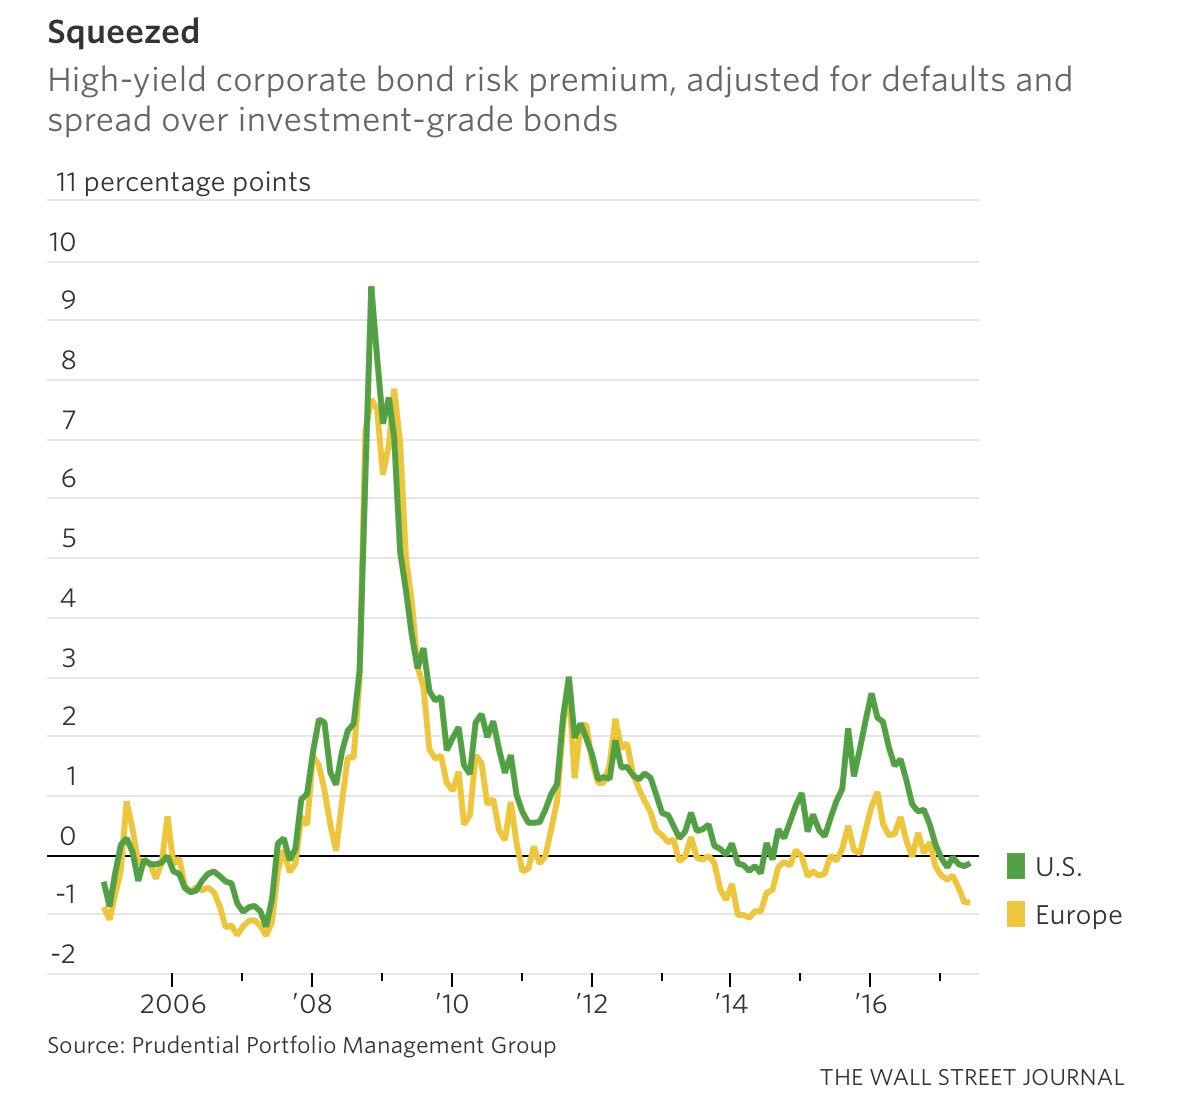
The chart below furthers the point that junk bonds are in vogue right now as the need for yield has reached the desperation phase. Both European and U.S. junk bonds are near their tightest spreads since 2014. Once we get below the 2014 level, we will match the 2007 level which is right before the financial crisis, obviously. Europe’s junk bond risk premium is lower than America’s partially because of the ECB’s corporate bond buying program. I would argue that anytime junk bonds’ risk premium is negative, it’s best to avoid them because they is overvalued when you adjust for the higher amount of defaults and the spread over investment grade bonds. This is a toxic combination as junk bonds aren’t even letting you see information about the company and simultaneously, they aren’t giving you great returns. The good part of this scenario is that leverage may not be as high as I previously exclaimed because corporate debt relative to GDP has been moving higher for decades likely because profits relative to GDP have also been moving higher because of increased international sales. 30% of S&P 500 sales are done overseas.