Leading Indicators
September leading indicators index fell and missed estimates, but it still doesn’t signal a recession is coming. August monthly growth rate was revised down from 0% to -0.2%. The September reading showed a 0.1% decline which missed estimates for a 0.2% gain. It’s surprising to see this report miss estimates by this much since we know what’s in it and the results of these metrics beforehand. Interest rate spreads hurt the index and stocks helped it. There is high uncertainty and weak business expectations. That should shock no one.
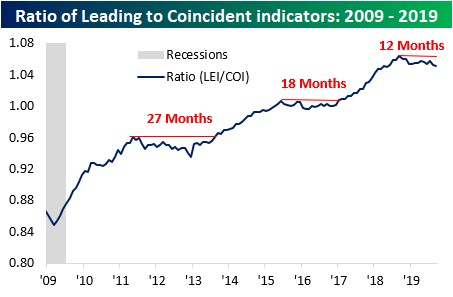
Another way to view the report is seen in the chart below. It shows the ratio between the leading economic index and the coincident index. If it falls slightly, like it did in the prior 2 slowdowns, it’s not a recession. So far, it has fallen slightly in the past 12 months like those aforementioned slowdowns. This ratio could start a new uptrend, in 6 or 15 months if it follows either one precisely. I’m guessing actual results will be in between. A 2020 economy will be helped by the global monetary stimulus. In the past year, the percentage of global central banks easing increased from 38% to 82.4%.
Bears are looking at the yearly change in the leading index, which shows a more negative tone. Yearly growth was 0.4% which is the 2nd lowest growth rate this cycle. Lowest was 0.3% growth in June 2016. It seems likely that economic growth will trough below where it did in 2016. As expected, the yearly growth in the September ECRI coincident index fell from 2% to 1.8%. It bottomed at about 1% in 2016. The leading index’s growth rate in the week of October 11th fell from 1.1% to 0.4%. That index will face easier comps as the year goes on.
Jobless Claims Steady Again
Jobless claims have been very steady in the past few months which goes against the bears’ call for a recession because of trade war uncertainty and the global slowdown. There’s beauty in seeing a metric that’s so important, ignoring the noise.
A growth slowdown clearly isn’t enough to cause big layoffs. Firms will simply hire less workers. In the week of October 12th, jobless claims increased 4,000 to 214,000. 4 week average increased 1,000 to 214,750.
Weakness In September Industrial Production
While the ISM manufacturing PMI is likely too negative, that doesn’t mean manufacturing is doing well. It is in a broad based contraction. This weakness isn’t centered in energy like it was in 2015-16. Almost 75% of manufacturing subsectors are in contraction which is the highest share since 2010 by a hair. On the positive side, monthly industrial production growth was revised from 0.6% to 0.8% in August. Manufacturing growth was revised higher by one tick to 0.6%.
Monthly production growth was -0.4% which missed estimates for -0.2%. It’s tough for growth to match such a strong monthly comp in a slowdown, but yearly industrial production growth was also weak. It was -14 basis points which is the first contraction since November 2016. The trough was -4.14% in 2015 as you can see in the chart below.

Manufacturing was also weak as its monthly growth was -0.5% which missed estimates by 2 ticks. Its yearly growth fell from -0.3% to -0.8%. To get an idea of the shallower depth of this weakness, growth troughed at -2% in 2015. That’s with the percentage of subsectors in decline very slightly more than the last slowdown.
Good news is the comp is about to get much easier as September 2018 was the peak of the last mini-cycle. Growth fell from 3.9% to 2.4% last October. We could see positive yearly growth next month all else being equal. To be clear, this is the same for the overall industrial production reading as growth went from 5.4% to 4% in September 2018 to October 2018.
With the weakness in manufacturing and industrial production, it’s no surprise the capacity to utilization rate fell from 77.9% to 77.5% which is just barely above the July 2019 low. That was the lowest percentage since September 2017.
September 2019 report was weakened by the GM strike which caused automotive output to fall 4.1% monthly. Yearly decline of 5% was the worst of this expansion. Excluding the GM strike, monthly industrial production and manufacturing growth would have been -0.2%.
Business equipment investment fell 0.7%. Mining fell 1.3% because of the weakness in oil prices. Energy is certainly weak, it’s just not close to as weak as it was in 2016. Yearly mining production growth was 2.6%. It troughed at -12.4% in April 2016. Finally, utilities production was up 1.4% monthly.
If The ISM Report Is Correct, It’s Bad News
Every time there is a slowdown, there will be a few indicators which signal a recession is coming. That’s because surveys have a margin of error and sentiment can swing wildly. ISM report is one of the indicators that I think is more bearish than reality. It’s consistent with most sentiment indicators, even from traders, but the hard data isn’t as bad.
As you can see from the chart below, if the ISM employment index is correct, it’s predicting a yearly increase in the unemployment rate. The chart shows the ISM employment index pushed forward by 4 months. Current unemployment rate is 3.5%. In the past 4 months of last year, the rate was 3.8%, 3.7%, 3.9%, and 4%. I can’t see the rate jumping higher than any of those readings later this year.

Conclusion
Leading economic indicators report was disappointing. But the ratio between the leading and coincident indicators signal this is just a slowdown and not a recession. Jobless claims were low again. Industrial production report showed some weakness because of cyclical reasons and because of the GM labor strike. ISM composite employment index suggests the unemployment rate will increase from last year in the next 4 months. I don’t see it happening. That being said, payrolls growth probably will fall.