Very Strong Kansas City Manufacturing Report
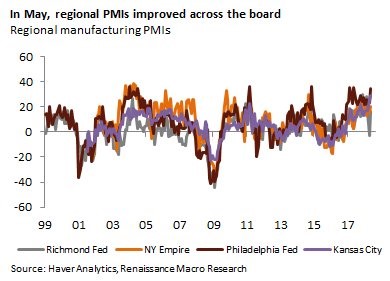
Across the board, manufacturing has been strong according to the regional Fed manufacturing indexes. As you can see, in the chart below, they have all turned up. The most recent report is from the Kansas City Fed. Its index was 29 which was above the highest estimate of 25, above the prior report of 26, and above the average estimate which was 22. All of the reports beat estimates. 3 of 4 of the reports beat the high end of the consensus range and the other one met the highest estimate. Therefore, I’m fairly certain the manufacturing ISM report will be good and more importantly industrial production will be strong in May. If the consumer improves slightly from last quarter, GDP will be strong.
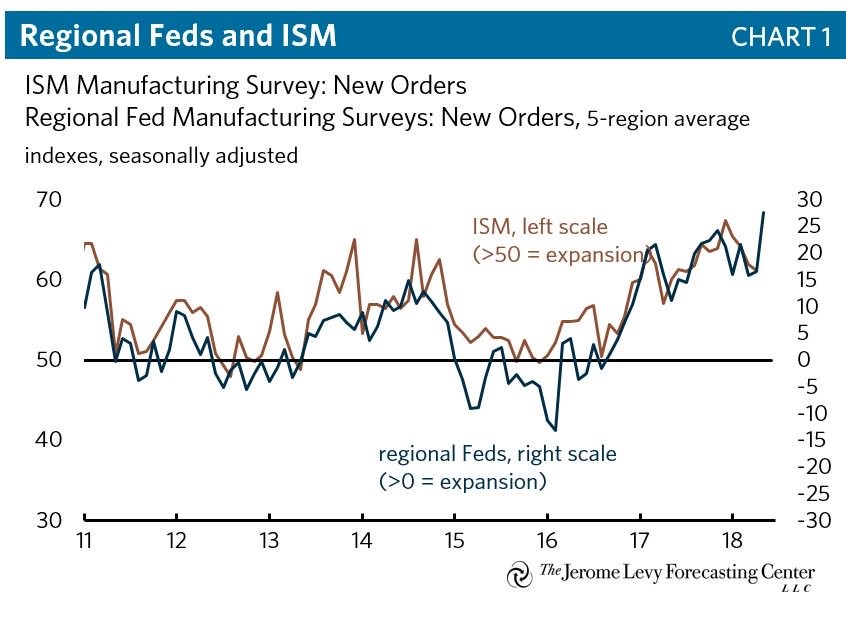
Let’s delve into the specifics of the report. Production was up 8 points to 41. The new orders index was up from 37 to 38. The chart below compares the average of the 5 regional Fed reports’ new orders to the new orders in the ISM report. The two metrics are correlated, implying the new orders from the ISM manufacturing index will increase. We will see that result on June 1st. Interestingly, prices were stable as the prices received index was down 7 points to 22 and the prices paid index was up one point to 53. The one slightly weak part of the report was the expectations for the next 6 months as the composite index fell 5 points to 26 and the new orders fell 4 points to 26. Let’s review a quote from the report. A business said “Our production is on record pace for this year due to increased drilling in the oil and gas industry. The economy is strong in our areas of production but continued rising oil prices will eventually set the industry up for a fall.” As you can see, energy gains are driving the manufacturing sector.
Markit PMI Was Very Strong
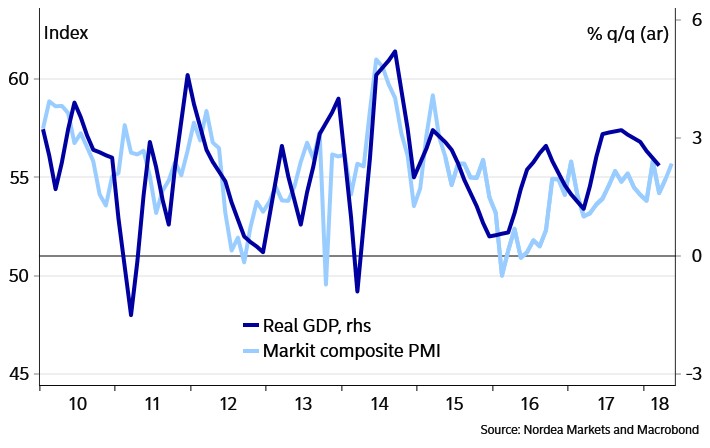
The CNBC GDP estimate as of May 24th was 3.5%. Many of the advanced surveys are supporting this optimism as most of the reports from May look very good. The Markit PMI flash reading for May is one of those reports. The composite improved as you can see from the chart below. This signals GDP might rebound. The index was 55.7 which beat the average estimate of 54.8 and the high end of the range which was 55.2. This was a 3 month high. The manufacturing report was amazing as the 56.6 reading beat estimates by one tenth and was 44 month high. The services index was 55.7 which beat the estimate for 54.6 and the high end of the consensus range which was 55.4. This was a 3 month high. Some of the other services reports have been tepid, so this is a good sign that the sector is headed in the same direction as manufacturing.
In the comments section of the report, it says these surveys are consistent with 200,000 jobs added and 2.5% to 3% GDP growth. If manufacturing was a larger sector, this would be even better. There was also important commentary on inflation. The input costs for manufacturing and services are up the most in 5 years; costs are up the most in 7 years for the goods producing sector. Supplier delays have reached a record high (highest in 11 years). Demand is high and energy prices are rising. This all speaks to higher inflation. We could see above 2% core PCE growth in May, but keep in mind that doesn’t include energy so it won’t run rampant or hit an 11 year high. Finally, business optimism is at a 3 year high similar to what has been shown in the NFIB small businesses report.
Fed Is More Optimistic & Agreeable
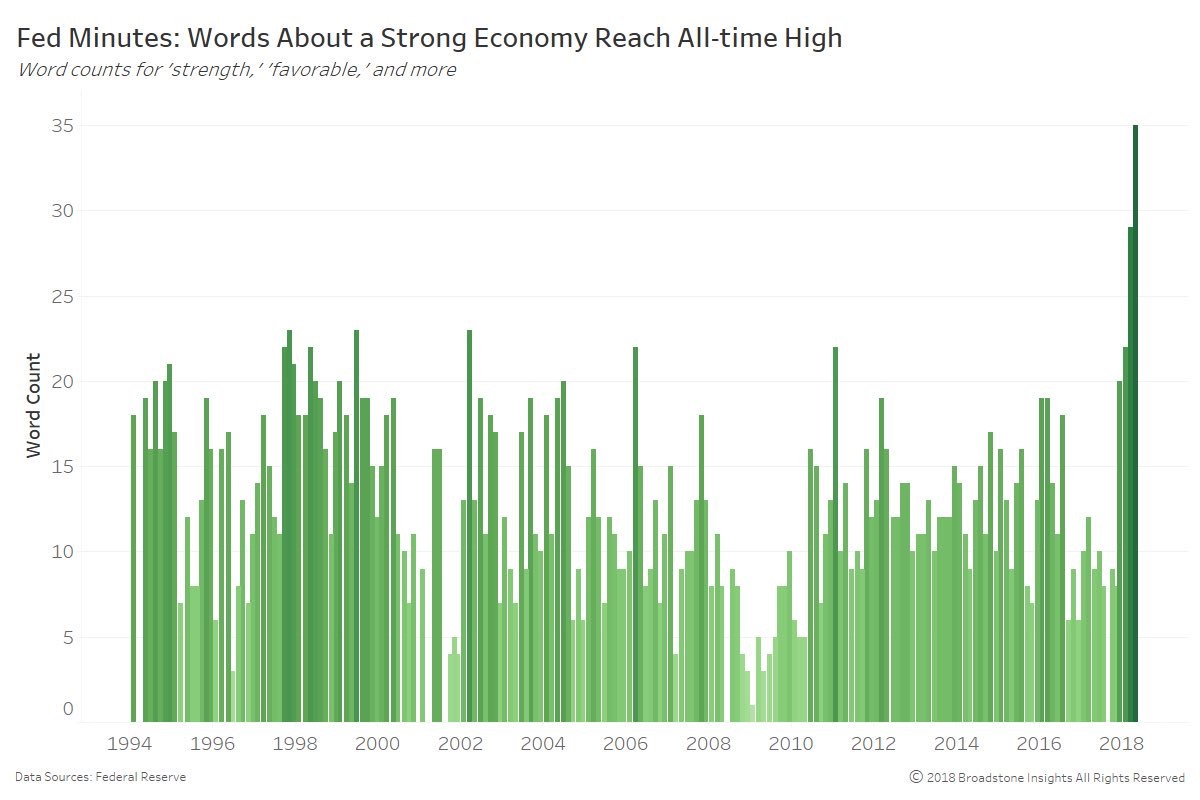
The chart below shows the amount of times the Fed has mentioned positive words about the economy such as strength, favorable, and others in its Minutes. The problem with this chart is it doesn’t take into account the changes in the length of the Minutes. Furthermore, the Fed has increased its level of transparency in the past few years under Yellen, so it’s tough to compare history. The chart seems to suggest that when the Fed is optimistic it’s a bad sign. This is just like how someone can say high earnings are bad because they occur before a top. I disagree that good news is bad news. It always looks easy in hindsight to spot when growth and optimism peaked, but it’s difficult to do so in real time. The number of times positive words are used is off the charts here, but that far from guarantees economic strength is near its peak. The Fed was modestly dovish in this meeting which suggests the economic cycle will continue for a few quarters longer.
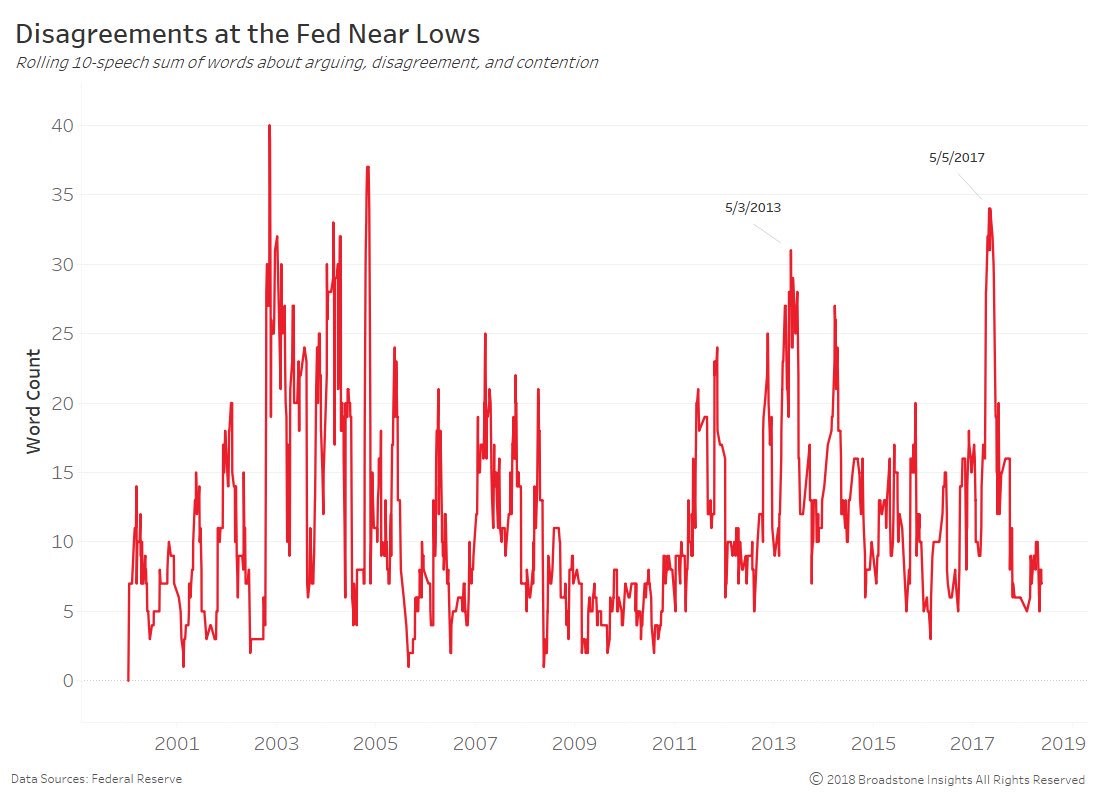
The chart below is similar to the one above in that it counts the number of times words are used in the Minutes. In this case, it uses the 10 speech sum of the disagreeing words such as arguing, disagreement, and contention. The Fed should always have various voices to prevent monolithic thought. However, it appears with the addition of the new members, the Fed has come to an agreement on policy. I think this is remarkable because policy choices are more difficult now than in the past few years because inflation is picking up.
The takeaway from this chart is that policy is more predictable because most FOMC members are on the same page. This is great news for the stock market as the end of the rate hike cycle typically has a lot of uncertainty. It appears the most agreement occurs when it’s clear the economy is in a recession. I wouldn’t be surprised to see the level of disagreement ratchet up again in 2019 as the end of the rate hikes is debated. There will already be economic uncertainty next year as growth decelerates. Adding in monetary policy uncertainty will be another negative catalyst for stocks.