Markit Manufacturing PMI - Existing Home Sales
Before getting into Markit Manufacturing PMI, let's review homes sales. June existing home sales missed estimates. But stayed near its recent range. Sales were revised higher from 5.34 million to 5.36 million in May.
In June sales fell back to 5.27 million which missed estimates for 5.32 million. While existing home sales don’t affect GDP because nothing is produced, this market makes up a majority of home sales, so it is critical. Monthly sales growth fell from 2.9% to -1.7% and yearly growth fell from -0.7% to -2.2%.
Yearly growth will be fine later in the year because comps will get easier, but sales will probably still be in the same range. Interest rates are low, real wage growth is low, and the unemployment rate is low.
Therefore, there is a lot that can go wrong with the housing market because the fundamentals are mostly positive. Good news is that what can go right is already happening, namely home price growth is slowing.
Sales were only slightly below the 3 month average which is 5.28 million. 3 month average started the year at 5.1 million. However, sales are near where they were in 2015. Single family sales fell 1.5% to 4.69 million.
Condo sales, which is a much smaller percentage of the market, fell 3.3% to 580,000. On a yearly basis, sales fell in all regions. Home prices rose 2.7% to $285,700. Supply increased 1% to 1.93 million.
As you can see from the chart below, the number of cash buyers is falling and the number of borrowers is increasing. Specifically, the percentage of cash sales fell from 22% to 16% yearly and from 19% in the previous month. Sales to investors also fell from 13% last year to 10%. That’s because of the decline in international buyers.

Example Scenario Of How Expensive Housing Got
Markit Manufacturing PMI - One of the first housing markets to rebound will probably be one of the cities that was very hot in 2018, but weak this year, such as Seattle.
To be clear, the current zero price growth in Seattle isn’t going to make up for the double digit growth in 2018. Let’s go through an example based on what happened in the past few years.
From June 2015 to June 2018, Seattle home prices went up 42%. National weekly wages went up 8% in that period. It’s possible wages went up more in Seattle, so let’s just say they went up 15%.
A person in this scenario could have went from making $50,000 per year to $57,500 per year. A potential future house price could have gone from $300,000 to $426,000 if it followed the average.
In this scenario, housing became highly unaffordable. A year where wages increase about 2% to 4% and housing prices are flat isn’t going to be enough to make housing affordable. There needs to be price declines in these overheated areas. Therefore, they aren’t about to see improved price growth just yet.
Markit Manufacturing PMI - MBA Applications
Despite the weakness in existing home sales this year, the MBA applications report has shown mostly positive year over year prints.
In the week of July 19th, the composite index fell 1.9% weekly after falling 1.1% weekly. Purchase index was down 2% after falling 4%, but it was still up 6% yearly. Refinancing index fell 2% after rising 2%.
Weak Manufacturing PMI & Improved Services PMI
Markit Manufacturing PMI - Many investors consider the July flash Markit PMI to be a win. But there were a bunch of weak readings within it. Composite index hit a 3 month high as it increased from 51.5 to 51.6.
It increased because of the service sector and in spite of the manufacturing sector. Services PMI increased from 51.5 to 52.2 which is also a 3 month high.
Manufacturing PMI was weak as it fell from 50.6 to 50 which is a 118 month low. In other words, it is a cycle low. This doesn’t make sense to me. Industrial production and manufacturing growth aren’t even negative on a yearly basis. Growth is higher than the slowdown from 2015-2016.
I think the trade war is causing sentiment weakness, making it worse than reality. Finally, the manufacturing output index fell from 51.2 to 48.9 which is a 119 month low.
Remember, these readings are from the first half of July, so things can change when the final monthly results come out. Maybe the latest in person negotiations between America and China will make manufacturing firms more optimistic.
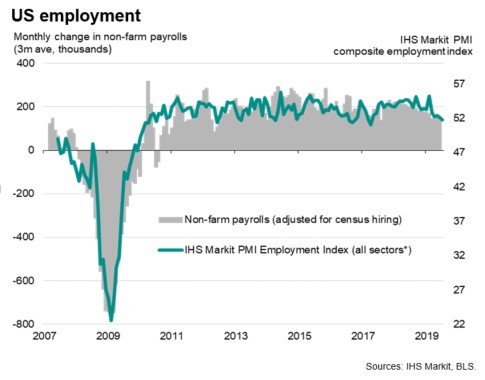
Even though the composite index hit a 3 month high, as you can see from the chart below, the employment index hit a 27 month low. Hiring is falling because of weakness in the short term business outlook.
Optimism was the lowest since July 2012. This employment reading is consistent with 130,000 jobs created in July. That’s down from the average of 200,000 in Q1 and 150,000 in Q2.
July BLS labor report comes out next Friday August 2nd. I don’t think the market would be devastated by 130,000 jobs added as it is near population growth.
Even though the services PMI showed improvement, service sector business expectations for the next 12 months fell to its lowest reading ever. This survey was started in October 2009.
Weakness in the manufacturing PMI was caused by lower production volumes, a decline in employment, and reduced stocks of purchases. The rate of production decline was the highest since August 2009.
Global uncertainty and weakness in the auto sector caused the weakness in the manufacturing PMI. Export sales from abroad fell at the fastest clip since April 2016. Even though the manufacturing PMI was at 50, it’s consistent with output declining at a quarterly rate of 1%.
Composite PMI is consistent with 1.6% GDP growth which is above the average of 1.5% in Q2. That average is towards the low end of estimates for Q2 growth. Specifically, the consensus range for Q2 growth is from 1.6% to 2.2%. NY Fed’s estimate of 1.41% is the lowest estimate I’ve seen. Just like Markit, it expects a rebound in Q3 as its Nowcast is calling for 1.88% growth.