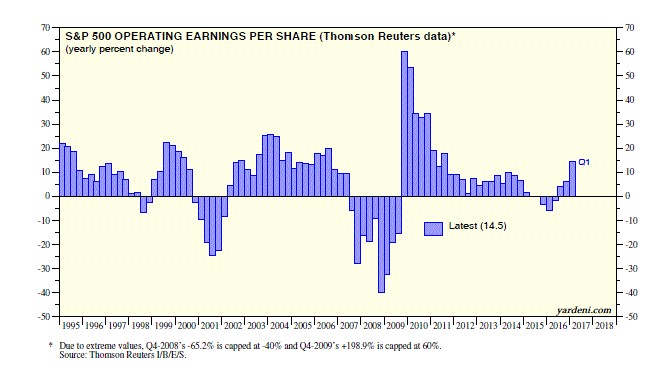
The stock market closed at a new record high on Thursday. The main reason for this rally is seen in the chart below. It shows year over year quarterly operating earnings growth since 1995. The mini-decline in earnings growth in 2015 and 2016 is like the one in 1998. Earnings growth had been sinking prior to both periods as 1998 and 2016 were both years in which the recovery had been getting old. Instead of falling into a normal recession, earnings declined and rebounded for one final hurrah. If this earnings recovery acts in concert with the one in the late 1990s, we have 4 more quarters of growth. The stock market is certainly acting similarly as then as there was a 45 day 19.3% correction in 1998 before it flew higher and had a blow off top. There was a 12.4% correction in 2015 and a 13.3% correction in 2015 and 2016. Since then, stocks have flown higher. Keep in mind the chart is slightly manipulated in 2008 and 2009 because the extreme values would cloud the movement in the other years.
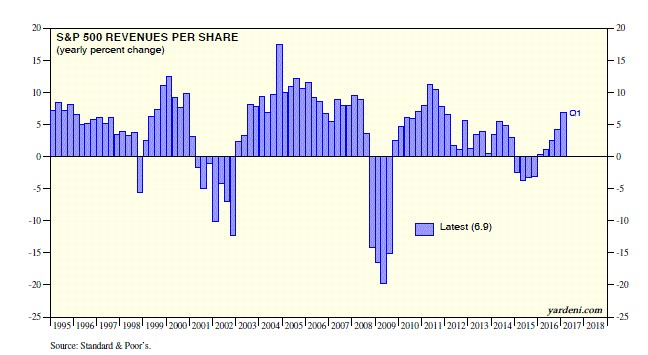
As I have mentioned previously, the earnings growth has been driven mostly by margin growth, not revenue growth. As you can see from the chart below, the revenue growth in Q1 2017 is not as impressive as the growth seen in 1998. Technically it doesn’t matter to investors whether revenue growth or margin growth drives profits. The problem is that margin growth reverts to the mean. Investors are seeing profit growth and ignoring the possibility that margin growth is less sustainable than revenue growth. They won’t care until margins dip.
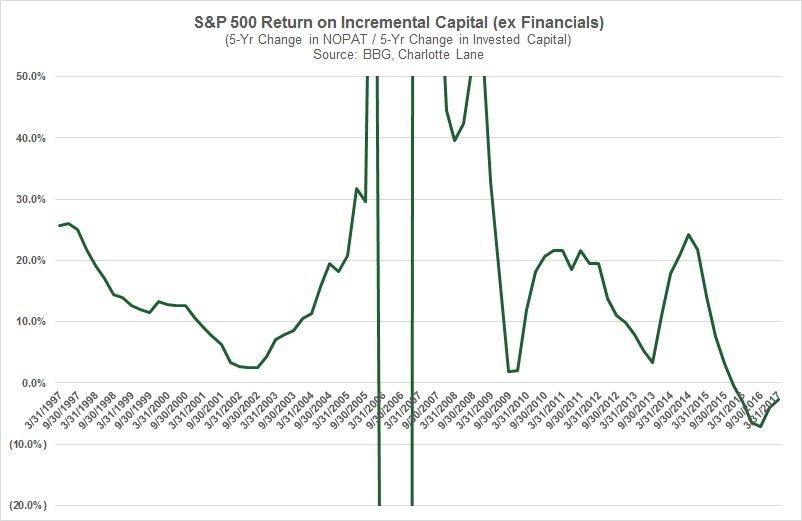
The new theory on Wall Street is that margins have reached a plateau and may even break new records because firms are more efficient than ever. There’s certainly an allure to how well Google and Facebook are doing, but this thesis doesn’t stand up to intellectual rigor. As you can see from the chart below, the return on incremental capital for S&P 500 firms has been negative for the past few quarters. No wonder why firms aren’t investing in capex. If firms were profit machines spewing out everlasting profits with more investment, they wouldn’t be plowing money into buybacks and dividends. The truth is that management teams don’t know what to invest in. The default is to buy back stock, but it would be better if firms could innovate more. They need to increase their employees’ productivity. If the labor market tightens in the next few months, wages may finally start accelerating. Combining accelerating wage growth with negative productivity would be a disaster for profit margins.
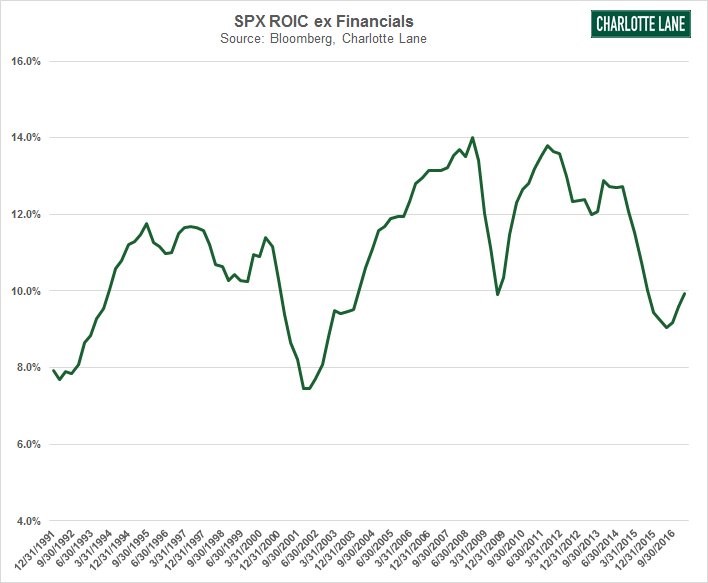
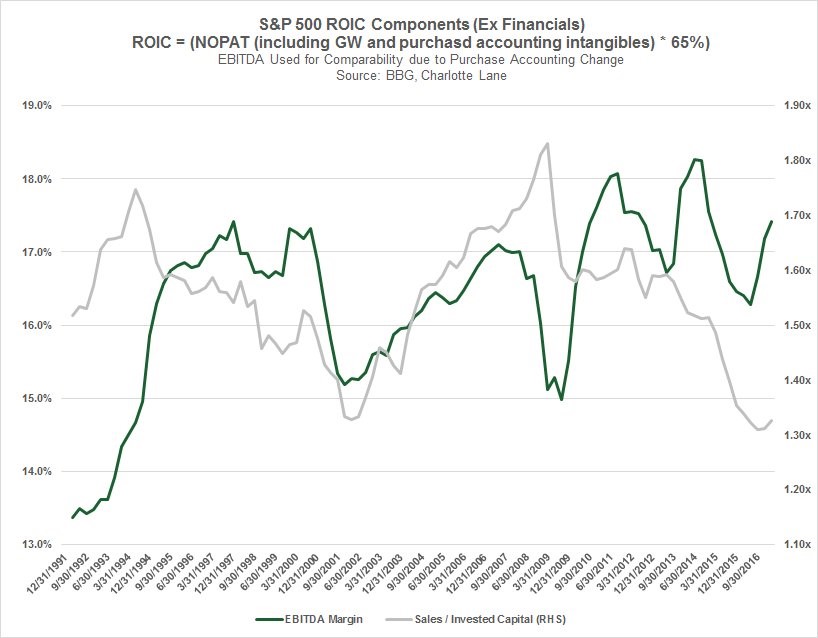
The chart below looks at the S&P 500’s return on invested capital. This rate declined in the past two recessions. It declined again in the past few quarters, but there has been no recession thanks to the central banks saving the day in early 2016. The ROIC has recovered to the level last seen during the worst of the financial crisis.
The chart below plots ROIC along with EBITDA margins. As you can see, EBITDA margins have been high which is a great divergence from ROIC; they are usually correlated. You can either make the argument that ROIC is going to catch up to margins or that margins will fall. Obviously increases in ROIC would be nirvana for the stock market as productivity would increase giving workers wage growth without crimping profit growth. It’s hard to imagine returns increasing at this point in the cycle. While it was also tough to see how profits would recover, that may be a false flag since ROIC is still languishing.
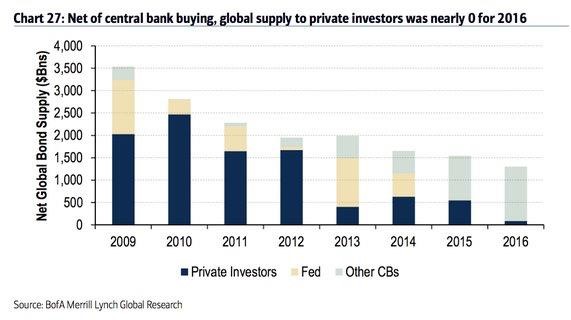
As I mentioned, the global central banks saved the economy from going into a recession in early 2016. The chart below shows how the central banks have taken control of the bond market. As you can see private investors have left the bond market in the past few years and so has the Fed. Global central banks have swooped in and sucked up all the supply pushing investors to equities.
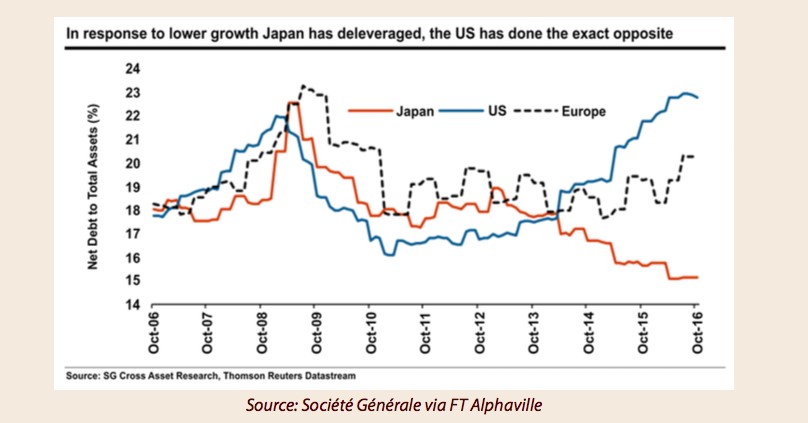
The big story for the American economy has been that it has increased leverage to substitute real productivity growth. I think quantitative easing is a response to the decline in GDP growth per capita, but some argue that QE is causing the problems the economy faces. The chart below shows the leverage America has put itself under. Leverage is higher than the 2008 financial crisis. European leverage is elevated, but it’s not precarious. Japan has deleveraged in the response to low growth. All three countries/groups of countries have central banks which purchased an inordinate amount of assets. 2018 will be the year of central banks finally having net balance sheet reductions as some will pause their buying and some will let the bonds they hold expire.
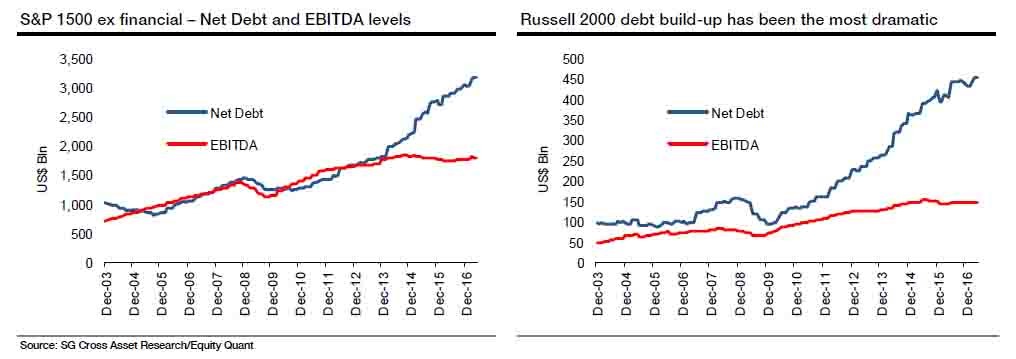
The chart below breaks down corporate leverage. The Russell 2000 firms have had a dramatic boost in debt which makes sense because interest rates on junk loans are low and small cap margins are falling. This is a clear house of cards which will eventually collapse. If interest rise, it will be a disaster. I think the overall bullish sentiment is the only thing holding the Russell 2000 up. I don’t think investors buying the Russell 2000 stocks are aware of this chart because the index had one of its best days of the year on Thursday as it was up 1.89%. It is up 2.85% for the year as tech stocks have replace small caps as the de facto risk on trade.
Conclusion
The stock market is rallying on Q1 earnings as margin expansion boosted growth. If you look deeper, you can see small caps are in dire straits as their margins are falling and their debt level is escalating. When small cap firms roll over, it will spread to large caps. The American economy is based on small business, so don’t be fooled into believing that Apple, Google, Amazon, and Facebook can rally indefinitely.