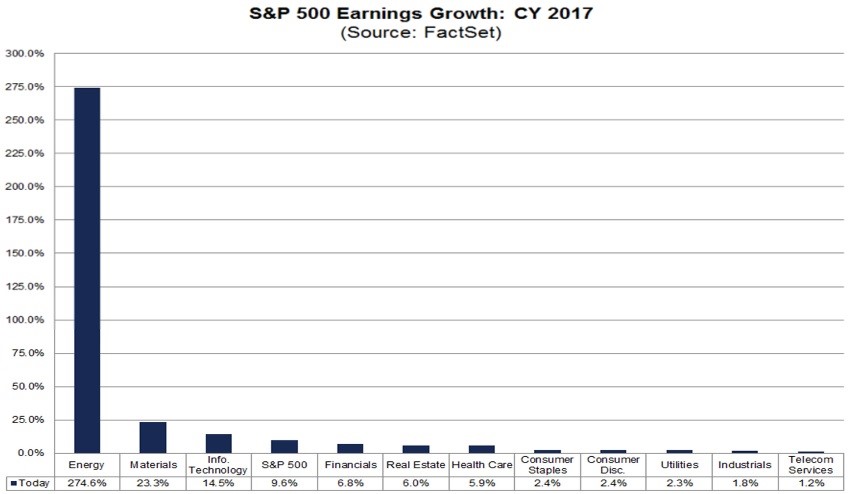
2017 Earnings Were Led By Energy, Materials, and Tech
At the beginning of the year, I expected 5%-7% earnings growth for 2017 based on the trend of earnings reports missing estimates. As we’ve discussed throughout the year, this year has been different from the past few because it has come close to meeting the initial estimates. As you can see from the chart below, earnings growth is expected to be 9.6% in 2017. With 3 quarters in the books, it would be surprising if the earnings fall to my range. This quarter was bolstered by energy which had 274.6% growth, materials which had 23.3% growth, and technology which had 14.5% growth. Obviously, the earnings growth in energy is unsustainable, while most expect tech to continue its growth. Without energy, earnings growth would have been 6.9%. Oil and Gas Equipment and Services had 165% growth. The energy sector had $10.6 billion in earnings in 2016 and $39.7 billion in earnings in 2017. Since tech is the biggest sector, it is the most important sector to focus on. The best industry within the tech sector was Semiconductor and Semiconductor Equipment which had 39% growth.
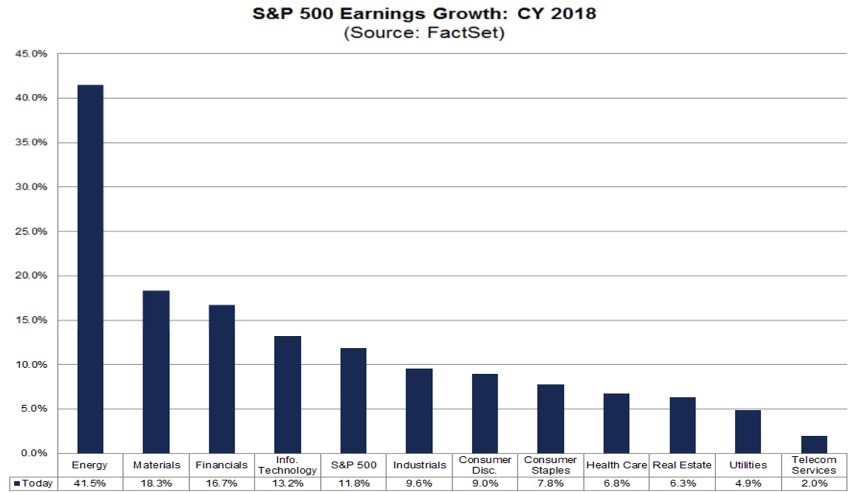
Future Earnings Expectations
As you can see from the chart below, 2018 earnings are expected to be driven by energy, materials, financials, and technology. Energy, materials, technology are expected to see a deceleration, while all the other sectors are expected to see acceleration. The winners of 2017 are expected to be the winners of 2018 and the underperformers of 2017 are expected to underperform in 2018, besides the financials which are expected to switch from underperforming to outperforming. This all adds up to 11.8% growth. It’s debatable if the growth being more balanced is a good thing. On the one hand, one sector missing expectations will have a smaller effect on growth because most sectors are expected to do well. On the other hand, the sectors with the most earnings are still going to be the most important. It’s also possible analysts are more focused on mean reversion than what firms are guiding to, meaning some of the improvements from the laggards won’t occur.
An example of how being focused on the average results failed is the overly conservative price targets for the S&P 500 at the start of the year. After the election in 2016, Estimize surveyed its analysts to predict where stocks would close 2017. They expected the S&P 500 would go up 3.5%, finishing the year at 2,217. The S&P 500 is now at 2,680. This supports the notion that year end predictions can be wildly inaccurate. Investor sentiment is much higher at the end of 2017 than the end of 2016, but the fundamentals of the economy are better. From 2016 to 2017, the economy went from o.k. to good. It’s expected that from 2017 to 2018, the economy will go from good to great, meaning there’s still upside.
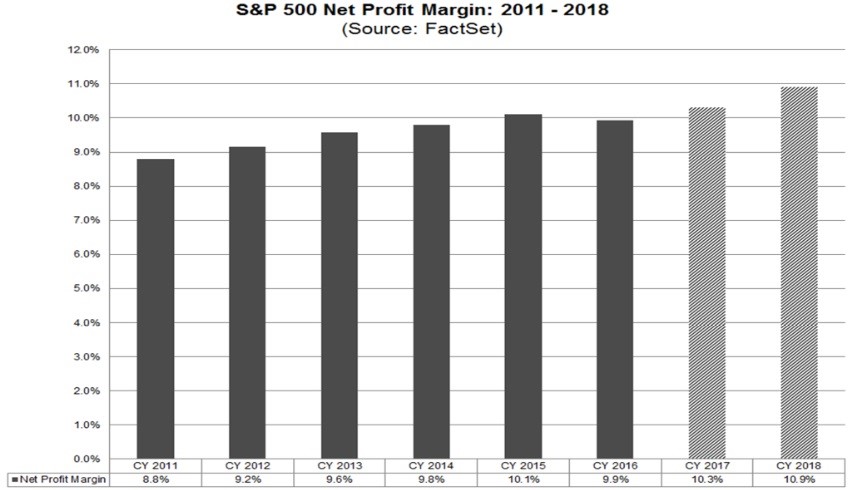
The catalyst of 2017 earnings growth was margin expansion. As you can see from the chart below, margins went up from 9.9% to 10.3%. Revenues were up 6.2%, meaning 3.8% of the earnings growth came from margin improvements. 2018 revenues are expected to increase 5.6%. That means earnings growth is expected to accelerate, while revenues are expected to decelerate. The sector with the most revenue deceleration is energy as its growth will fall from 20.3% to 7.0%. This earnings gap is expected to be met by margins improving by 0.6%. As you can see, only 2016 had margin deceleration. In Q3 2017, the sector with the best year over year margin improvement was energy which improved from 2.2% to 4.4%. Even though you’d expect financials to have higher margins because of the rate hikes in late 2016 and the first half of 2017, margins compressed from 14.6% in Q3 2016 to 13.7% in Q4 2017.
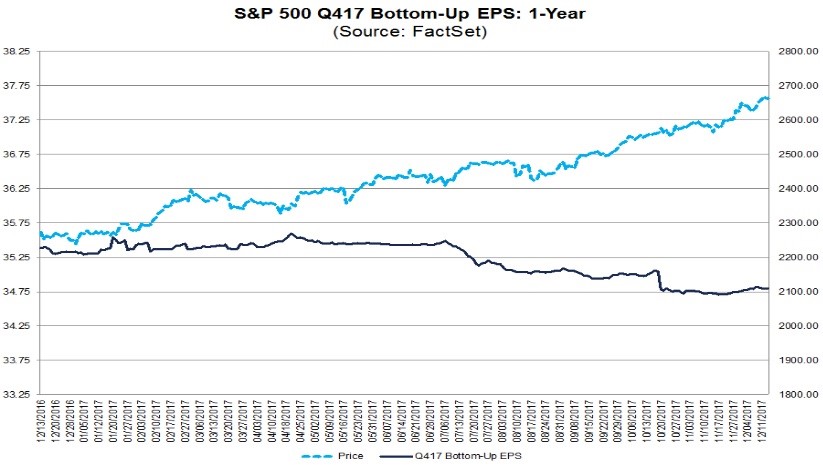
The 2018 earnings estimates are important to look at since we’re at the end of the year, but Q4 earnings will be the next data point we get. For those confused how estimates work, although 1 quarter of results doesn’t make up much of the valuation of a firm, because it’s the latest data point, it can have a drastic impact on forecasts which make up the entire valuation of the firm. As you can see, this was a great week for Q4 estimates as they increased. Q4 is everything that Q3 should have been if there weren’t two devastating hurricanes. On September 30th earnings growth in Q4 was expected to be 11.3% and now it’s expected to be 10.9%. On the other hand, revenue growth went from 5.7% on September 30th to 6.7% today. This puts less pressure on margins to achieve the estimated earnings growth.
These improvements mean the 2017 earnings estimates have been stable for two months. The solid estimates for Q4 along with the prospect of corporate tax cuts have brought the 2018 bottom up estimates to their highest point in about 5 months. They are at $146.58. That’s still $6.42 below JP Morgan’s estimate, meaning the average estimate can increase further because of the tax cuts.
Excessive Valuations
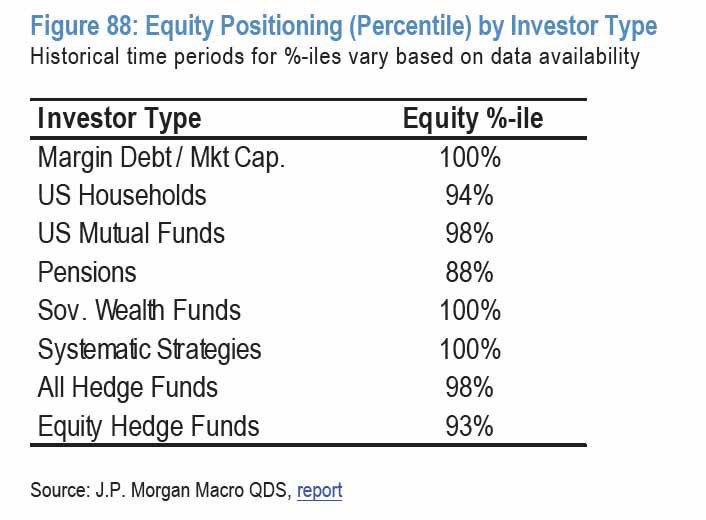
It’s interesting to see how JP Morgan has a bullish S&P 500 price target while it puts out a report which includes the slide below. As you can see, equity hedge funds have a long position in stocks in the 93rd percentile. Household stock ownership is in the 94th percentile and mutual fund ownership is in the 98th percentile. It’s not shocking to see investors are overweight stocks since interest rates are low and the earnings growth picture looks great.
Conclusion
Expectations are high for 2018. Each sector is forecasted to perform well. The first step towards a great 2018 will be a solid Q4 2017 earnings season which starts in a month. I will be anxiously awaiting how the holiday season played out. I have high expectations for consumer spending. The iPhone X is probably the single most important product that we’ll get the sales results for.