October CPI Mildly Disappoints
CPI report had a lot of bang for its buck on Thursday. Yields were already headed lower because the long bond was oversold and because COVID-19 shutdowns are increasing. Adding a disappointing CPI piled onto the trade. October CPI showed less inflation which is the opposite of what the ISM and Markit reports showed.
Investors don't seem worried about inflation in the near term now that COVID-19 is back and worse than it was in the summer. Inflation should increase after COVID-19 is put at bay via the vaccines. But until then there is a low chance of it getting above 2%.
Specifically, monthly headline CPI was 0% which missed estimates and fell from 0.2%. Yearly CPI was 1.2% which was down from 1.4% and missed estimates by a tick. Monthly core CPI was 0% which missed estimates and the consensus which were 0.2%. Finally, core CPI was 1.6% which missed estimates and the consensus of 1.7%. That’s an across the board miss, but the misses weren’t that big.
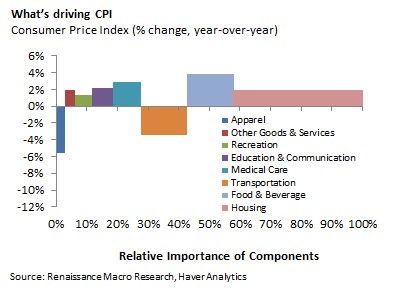
The chart above is an amazing depiction of the drivers of CPI. As you can see, if housing was an equal part of the index, it wouldn’t drag inflation down much, but because it is the largest part of the index, it is the biggest driver of the weakness in CPI. Notably, the biggest story of this report is the decline in healthcare inflation.
Food inflation was 3.9% because of both food at home and food away from home. They were 4% and 3.9%. Once again, meats, poultry, eggs, and fish caused food at home inflation to be high as its inflation was 6.1%. Limited service meals had a large 5.7% spike in prices because of demand for quick meals with social distancing.
Energy had a 9.2% decline in prices which was driven by the 18.1% decline in commodities prices. Fuel oil was down 28.2% and gas was down 18%. These are going to make for very easy comps next year when the economy reopens.
Within core inflation, commodities inflation was only 1.2%. Lowest inflation in that category was apparel which had a 5.5% decline in prices. Highest inflation was in used cars and trucks which was 11.5%. That’s set to decline because most of the people who needed a used vehicle now that public transportation is less safe have already bought one.
When public transportation comes back, there will be a supply glut as people will sell their vehicle. Core services inflation was only 1.7%. Transportation services inflation was -5.1% and shelter inflation was 2%. That’s because it is based on rents which have come down. House price growth is much higher than 2%.
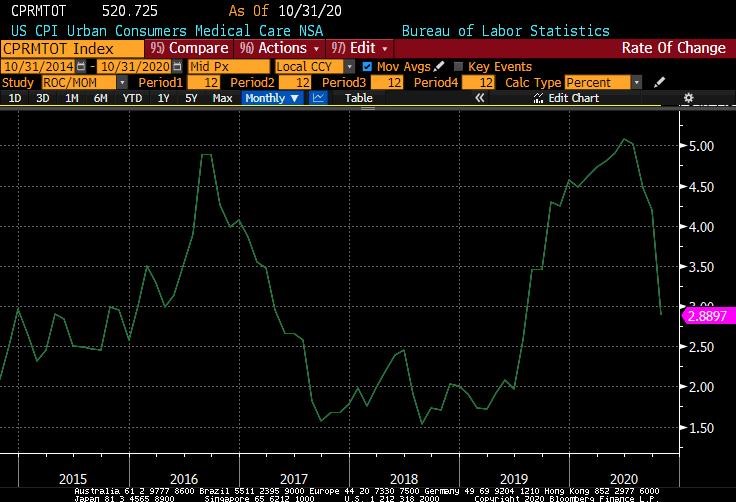
Medical care inflation was 3.7% which sounds high, but is actually very low compared to where it was earlier in the year. It was down from 4.9% in September and the peak of 6% in June. Most knew medical care services inflation would fall this month because the comp was 7 tenths harder.
This was a bigger decline than expected as the 2 year stack fell 0.5%. Medical care commodities inflation crashed from 0.9% to -0.8% which caused the 2 year stack to fall 0.4%. It’s very important to note the stack change or else you’re being influenced by the comp when it moves a lot.
Very Solid Jobless Claims Report
Latest jobless claims report was very good. In the week of November 7th, seasonally adjusted initial claims fell from 757,000 to 709,000 which is a massive 48,000 decline. That was below the consensus which was 737,000. Non-seasonally adjusted initial claims finally hit a new cycle low.
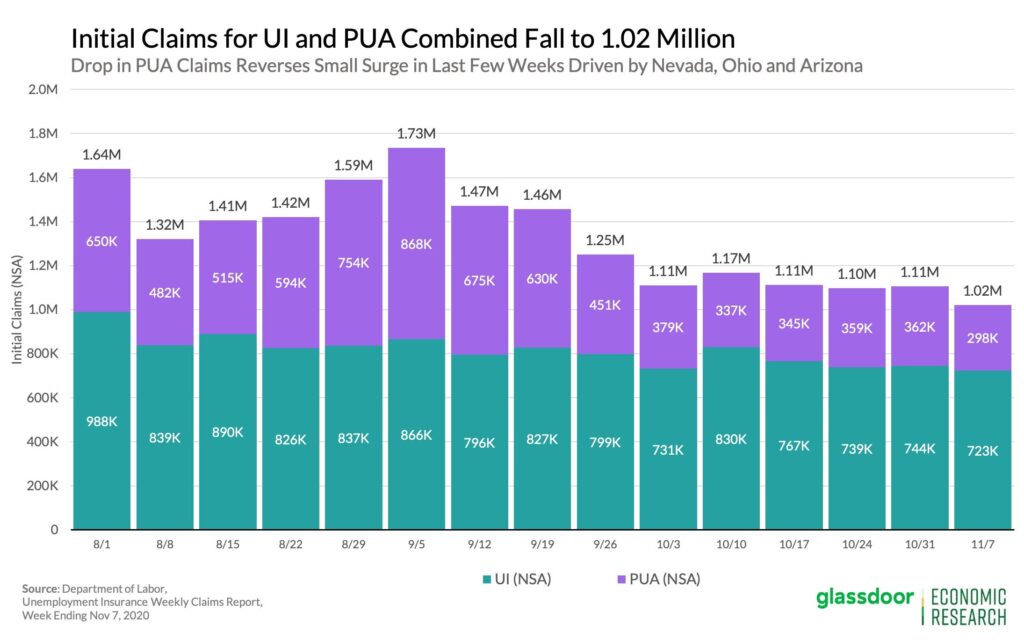
They fell from 744,000 to 723,000. That is about 8,000 below the previous cycle low 5 weeks prior. PUAs fell 64,000 to 298,000. That means combined they fell 7.8%. States with the biggest declines in PUAs were Nevada (-32,000), Ohio (-18,000), and Arizona (10,000).
As you can see from the chart below, NSA claims and PUAs add up to about 1 million. Obviously, PUAs are very volatile. But it’s impressive to see jobless claims continue to fall even as COVID-19 is ravaging the country. This makes it seem like the virus won’t hurt the labor market unless there are shutdowns.
Obviously, when we have a very bad flu season, it doesn’t hurt the economy much. COVID-19 is certainly another beast, but this data should calm your nerves about the economy in the near term. One wonders how long this improvement can last with the crisis getting worse.
Continued claims continued their long decent lower. We are almost at the peak following the last recession. They fell from 7.222 million to 6.786 million in the week of October 31st. That 436,000 decline was the lowest decline since there was no change in the week of September 12th.
To be fair, there is less room for them to fall now. If they fell at this past report’s rate for another 10 weeks, they would be back to normal. In the week of October 24th, PEUCs rose 160,000, but extended benefits actually fell 21,000 which means the total number of people on benefits fell again. Continued claims were down 598,000 that week. Total, including all the various programs, was a net decline of 374,000.
If the economy reopens at the current level of unemployment, we could see the labor market back to normal within a few weeks. Problem is the economy isn’t going to reopen until the spring and there is a chance the data gets worse in the meantime. Worst thing about the current situation is we are in a race against time.
We need these people on pandemic claims to get their jobs back before the end of the year because the benefits will expire. Another problem is COVID-19 is seemingly worse than it was in the summer and quickly approaching the spring peak. There are 13.5 million people on PEUCs and PUAs. That would be a massive number of people losing benefits in what could be the worst part of this pandemic.