

Tesla just hit $440. Retail traders see consolidation. Institutions see trouble.
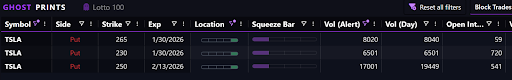
Someone just dropped $238,000 on far out-of-the-money puts. The $250 strike. Expiring January 31st.
This trade was filled with zero hesitation. Ask price. No haggling.
Most traders missed it entirely. The Ghost Prints Surveillance Console didn't.
This is a pattern we've seen before. And it preceded major selloffs in other mega-cap names.
Here’s how you can turn it into a trade idea.
We've Seen This Movie Before
First, far out-of-the-money puts appeared on TSM. Way out. Strikes that seemed absurd.
The market ignored them.
Then closer strikes started trading. The $300s. The $280s. The $260s. Downside pressure followed. The stock sold off hard.
Tesla's showing the identical setup. The $250 puts just printed.
These aren't immediately impactful. Zero delta at the time of the trade. But they signal where institutional capital expects trouble.
If this follows the TSM pattern, we'll see closer strikes accumulate next. Then the real selling begins.
The Valuation Nobody's Talking About
Why would institutions bet against a $440 stock? The numbers tell you.
Tesla trades at 90% above fair value. Not a typo. Ninety percent overvalued based on fundamental metrics.
The stock sits at 18 times book value versus a median of 13.66.
Price to sales ratio of 16.14 versus median of 7.31. These aren't tech company margins. Tesla manufactures cars.
Net margins: 5%. Gross margins: 17%.
Compare that to GM's 9% gross margin and 1.63% net margin. Tesla's better. But not 30 times GM's market cap better.
Earnings Are Moving Backwards
Here's where the story breaks down completely.
Tesla made $2.42 per share in 2024. Analysts expect $1.64 this year.
That's backwards.
For 2025, projections show $2.17. Still below 2024 levels. The growth story isn't just slowing. It's reversing.
And earnings drop January 28th. That's twelve trading days away.
Remember that $238,000 put position? It expires January 31st. Three days after earnings.
That's not coincidence. Someone's betting on post-earnings weakness, not the immediate reaction.
Technical Setup Confirms the Risk
The chart agrees with the options flow.
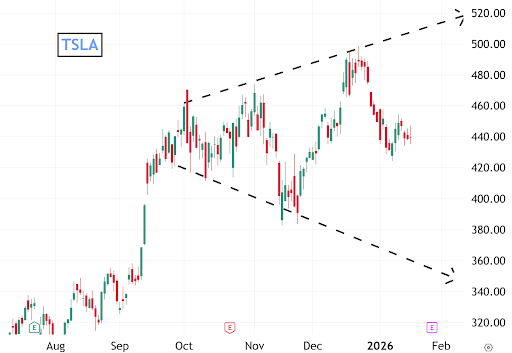
Tesla's consolidating in a broadening formation. The stock sits dead center of its November to December range. Around $440.
Broadening formations aren't stable. They resolve with violent moves.
Downside breaks target $380. That's a measured move matching the prior leg down.
Upside faces resistance at $470, then prior highs near $490.
But here's what matters most.
The volatility skew shows more crash risk being priced in than upside potential. Even with call buying activity, puts command higher implied volatility across the board.
More participants expect downside than upside. And they're willing to pay for protection.
Earnings Create Binary Risk
January 28th sets the stage.
Earnings reports are coin flips. You can be right on direction and still lose if you're holding through the announcement.
The options market is pricing in a massive move. Straddles suggest a $50+ swing either direction. That's over 11% in a single session.
Smart traders will take profits before that event.
You want exposure to the drift lower into earnings, not through them.
Everything Points the Same Direction
Institutions don't throw $238,000 at lottery tickets. They position ahead of moves they expect to materialize.
The valuation extreme is unsustainable.
Earnings are moving backwards.
Technical structure shows consolidation before a breakout.
The options market prices more downside risk than upside opportunity.
Most retail traders will keep chasing momentum. They'll see $440 as support and buy dips. They'll ignore the warning signs until it's too late.
The TSM pattern played out exactly as the options market predicted.
Tesla's following the same script. The Ghost Prints Console caught this signal before the crowd noticed.
What you don't know about Tesla can hurt you.
Now you know.
Brandon Chapman, CMT
Creator of Ghost Prints